Volume 32, Number 2—February 2026
Research
Using Routine Surveillance Data to Assess Dengue Virus Transmission Risk in Travelers Returning to the United States
Kristyna Rysava1, Zachary J. Madewell1 , Maile B. Thayer, Liliana Sánchez-González, Kamalich Muniz-Rodriguez, Ashley Brown, Julie Thwing, Laura E. Adams, Gabriela Paz-Bailey, and Michael A. Johansson
Figure 2
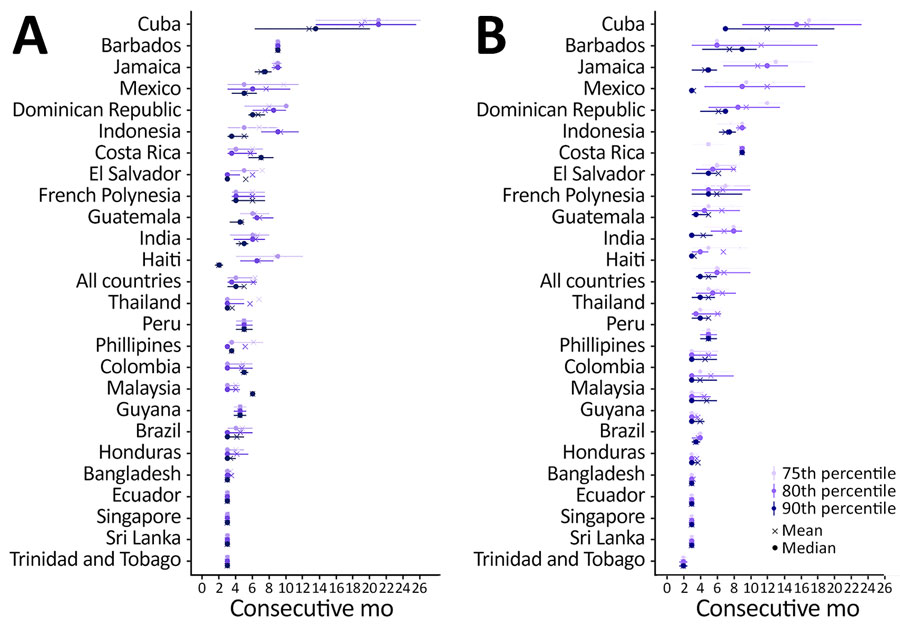
Figure 2. Duration of dengue outbreak warnings by country of exposure for travelers returning to the United States, based on different percentile thresholds in retrospective and real-time datasets, 2010–2024. A) Retrospective (complete) ArboNET data. B) Real-time data available at each monthly timepoint. Panels show the distribution of consecutive months classified as high-risk for dengue based solely on the 75th, 80th, and 90th percentile thresholds. Horizontal lines represent the interquartile range of outbreak duration for each country; median and mean warning lengths are indicated.
1These first authors contributed equally to this article.
Page created: January 29, 2026
Page updated: February 19, 2026
Page reviewed: February 19, 2026
The conclusions, findings, and opinions expressed by authors contributing to this journal do not necessarily reflect the official position of the U.S. Department of Health and Human Services, the Public Health Service, the Centers for Disease Control and Prevention, or the authors' affiliated institutions. Use of trade names is for identification only and does not imply endorsement by any of the groups named above.