Volume 32, Number 2—February 2026
Research
Using Routine Surveillance Data to Assess Dengue Virus Transmission Risk in Travelers Returning to the United States
Figure 3
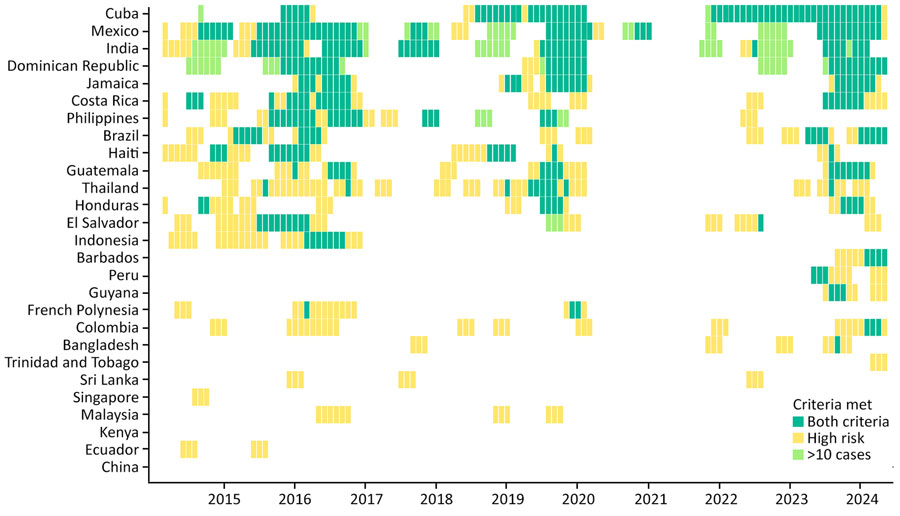
Figure 3. Monthly dengue risk classifications among travelers returning to the United States, by country, by using real-time data and dual-alert criteria, 2014–2024. Each tile represents 1 country-month and is colored according to the criteria met: dark green for months that met both criteria (dengue case counts exceeded the 80th percentile threshold and met the >10 case-criterion in the previous 3-month window), yellow for months exceeding the 80th percentile threshold only, and light green for months meeting the >10-case criterion but below the transmission threshold. Blank tiles indicate months that met neither criterion. The high transmission threshold was based on the 80th percentile of modeled country-specific traveler case distributions (real-time or annually updated). Countries are ordered by the total number of months that met both criteria.
1These first authors contributed equally to this article.