Skip directly to site content Skip directly to page options Skip directly to A-Z link Skip directly to A-Z link Skip directly to A-Z link

Disclaimer: Early release articles are not considered as final versions. Any changes will be reflected in the online version in the month the article is officially released.

Volume 32, Number 5—May 2026

Dispatch

Exposure in Horses to Human Tick-Borne Relapsing Fever Agent Borrelia persica, Israel, 2025

Dor ShwartzComments to Author , Lior Haras, Yaarit Nachum-Biala, Sharon Tirosh-Levy, Amir Steinman, and Gad Baneth
Author affiliation: Hebrew University of Jerusalem, Koret School of Veterinary Medicine, Rehovot, Israel

Main Article

Figure 1

Comparative analysis of serologic responses of horses exposed to human tick-borne relapsing fever agent Borrelia persica, Israel, 2025. Box-and-whisker plot demonstrates optical density measurements from seropositive (blue), seronegative (red), and negative control (green) horses. The dashed line represents the established cutoff value (optical density = 0.35). Statistical significance was determined using a Kruskal–Wallis test followed by Dunn multiple comparison test. Results significantly distinguish between the seropositive horses compared with the seronegative and control groups, whereas the seronegative group did not significantly differ from the negative control. Horizontal lines within boxes represent median values; box tops and bottoms indicate the upper and lower quartiles; error bars represent ranges. p values are indicated.

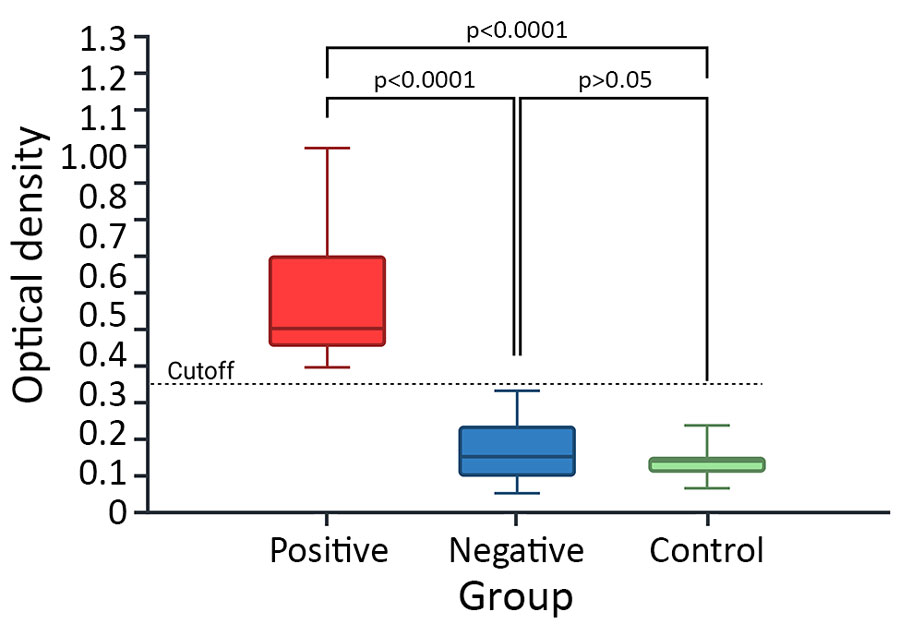
Figure 1. Comparative analysis of serologic responses of horses exposed to human tick-borne relapsing fever agent Borrelia persica, Israel, 2025. Box-and-whisker plot demonstrates optical density measurements from seropositive (blue), seronegative (red), and negative control (green) horses. The dashed line represents the established cutoff value (optical density = 0.35). Statistical significance was determined using a Kruskal–Wallis test followed by Dunn multiple comparison test. Results significantly distinguish between the seropositive horses compared with the seronegative and control groups, whereas the seronegative group did not significantly differ from the negative control. Horizontal lines within boxes represent median values; box tops and bottoms indicate the upper and lower quartiles; error bars represent ranges. p values are indicated.

Main Article

Page created: March 31, 2026
Page updated: April 28, 2026
Page reviewed: April 28, 2026
The conclusions, findings, and opinions expressed by authors contributing to this journal do not necessarily reflect the official position of the U.S. Department of Health and Human Services, the Public Health Service, the Centers for Disease Control and Prevention, or the authors' affiliated institutions. Use of trade names is for identification only and does not imply endorsement by any of the groups named above.
file_external