Skip directly to site content Skip directly to page options Skip directly to A-Z link Skip directly to A-Z link Skip directly to A-Z link

Disclaimer: Early release articles are not considered as final versions. Any changes will be reflected in the online version in the month the article is officially released.

Volume 32, Number 6—June 2026

Research

Association of Frailty and Frailty Trajectory with Risk for Respiratory Infectious Diseases

Jin Yang1, Hao Yan1, Huan Chen, Dan Liu, Zhihao Li, and Chen MaoComments to Author 
Author affiliation: School of Public Health, Southern Medical University, Guangzhou, China; National Institute of Health Data Science of China, Southern Medical University, Guangzhou

Main Article

Figure 3

Restricted cubic spline curves from linear regression analysis of frailty changes associated with risk for respiratory infectious diseases. A–D) Dose-response relationships of change in frailty index associated with incident respiratory infectious diseases (A), influenza (B), other acute lower respiratory tract infection (C), and pneumonia (D). E–H) Dose-response relationships of change in physical frailty associated with incident respiratory infectious diseases (E), influenza (F), other acute lower respiratory tract infection (G), and pneumonia (H). Blue lines indicate fitted HR curves; shading indicates 95% CI; horizontal dotted lines indicate HR of 1; vertical lines indicate 0 change. Analyses were adjusted for age, sex, ethnicity, education level, Townsend deprivation index, smoking status, alcohol consumption status, cumulative dietary risk factor score, PM2.5 (exposure to particulate matter <2.5 mm), nitrogen dioxide and nitrogen oxide levels, body mass index category, sleep duration, sleeplessness, and daytime dozing. HR, hazard ratio.

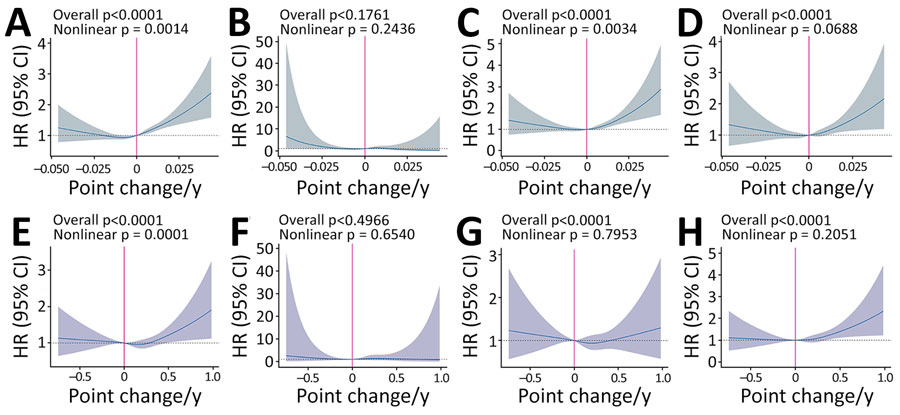
Figure 3. Restricted cubic spline curves from linear regression analysis of frailty changes associated with risk for respiratory infectious diseases. A–D) Dose-response relationships of change in frailty index associated with incident respiratory infectious diseases (A), influenza (B), other acute lower respiratory tract infection (C), and pneumonia (D). E–H) Dose-response relationships of change in physical frailty associated with incident respiratory infectious diseases (E), influenza (F), other acute lower respiratory tract infection (G), and pneumonia (H). Blue lines indicate fitted HR curves; shading indicates 95% CI; horizontal dotted lines indicate HR of 1; vertical lines indicate 0 change. Analyses were adjusted for age, sex, ethnicity, education level, Townsend deprivation index, smoking status, alcohol consumption status, cumulative dietary risk factor score, PM2.5 (exposure to particulate matter <2.5 mm), nitrogen dioxide and nitrogen oxide levels, body mass index category, sleep duration, sleeplessness, and daytime dozing. HR, hazard ratio.

Main Article

1These first authors contributed equally to this article.

Page created: April 22, 2026
Page updated: May 18, 2026
Page reviewed: May 18, 2026
The conclusions, findings, and opinions expressed by authors contributing to this journal do not necessarily reflect the official position of the U.S. Department of Health and Human Services, the Public Health Service, the Centers for Disease Control and Prevention, or the authors' affiliated institutions. Use of trade names is for identification only and does not imply endorsement by any of the groups named above.
file_external