Volume 32, Number 8—August 2026
Research Letter
Surveillance of Ticks and Tickborne Borrelia, Ehrlichia, and Rickettsia spp., Texas, USA, 2014–2021
Yan Zhang, Elizabeth A. Mitchell, Rebecca J. Kilgore, and Michael S. Allen
Figure 1
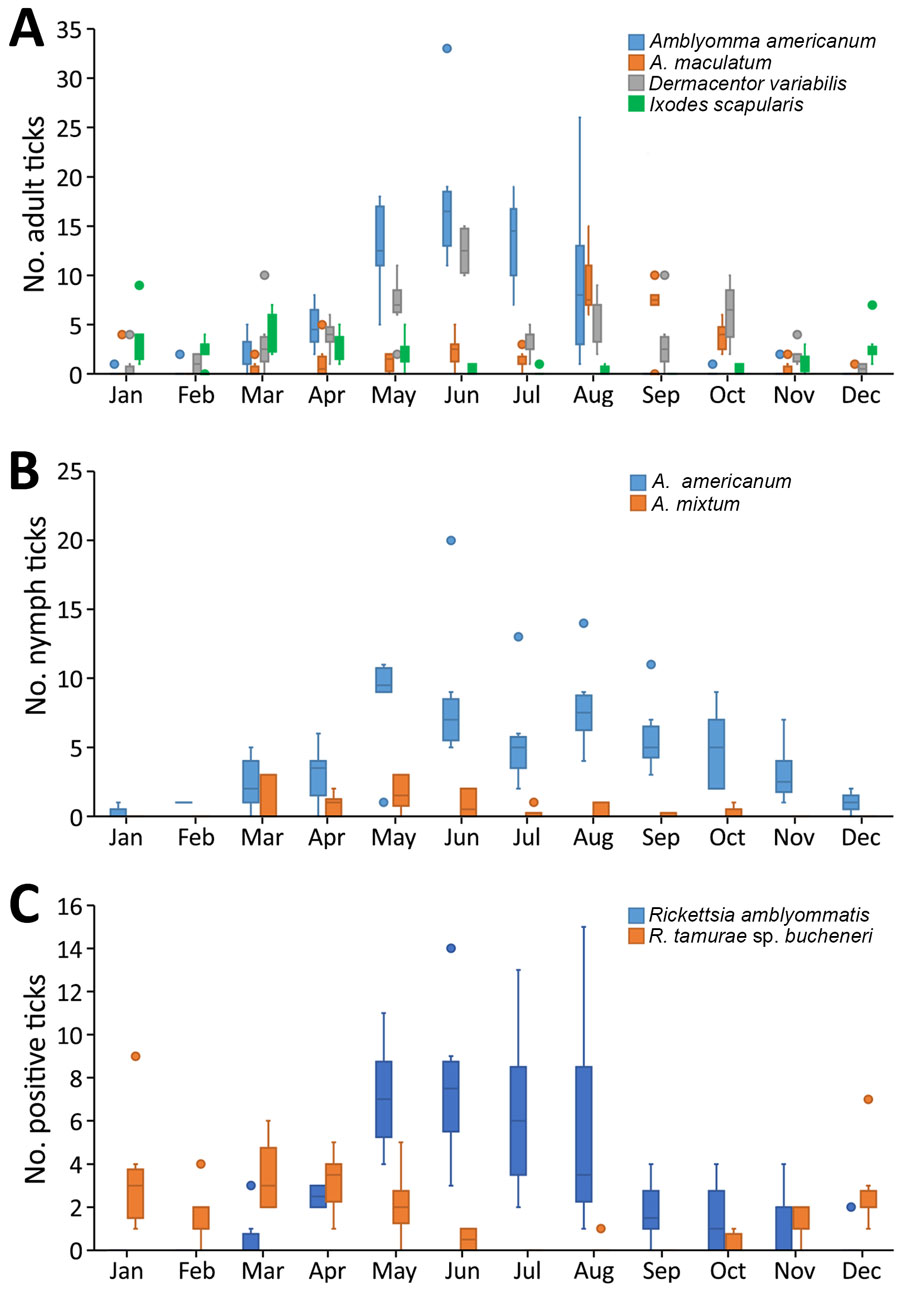
Figure 1. Box plot graph displaying temporal patterns of ticks submitted in Texas, USA, 2014–2021. A) Adult ticks; B) nymphs; C) Rickettsia amblyommatis and R. tamurae subspecies buchneri–positive ticks. Horizontal lines within boxes represent medians, box tops and bottoms indicate interquartile ranges (IQRs), and error bars represent minimum value within 1.5 × IQR below 25% and maximum value within 1.5 × IQR above 75%. Outlier points are data points <25% − 1.5 × IQR or >75% + 1.5 × IQR.
Page created: June 28, 2026
Page updated: July 27, 2026
Page reviewed: July 27, 2026
The conclusions, findings, and opinions expressed by authors contributing to this journal do not necessarily reflect the official position of the U.S. Department of Health and Human Services, the Public Health Service, the Centers for Disease Control and Prevention, or the authors' affiliated institutions. Use of trade names is for identification only and does not imply endorsement by any of the groups named above.