Volume 32, Number 8—August 2026
Research
Rapid Expansion of Highly Pathogenic Avian Influenza A(H5N1) Clade 2.3.4.4b Genotype D1.1 Virus across Flyway Regions, North America, Fall 2024
 , Temitope O.C. Faleye, Angelica Urquidez-Negrete, Arvind Varsani, Ann Fan, and Anne Justice-Allen
Figure 4
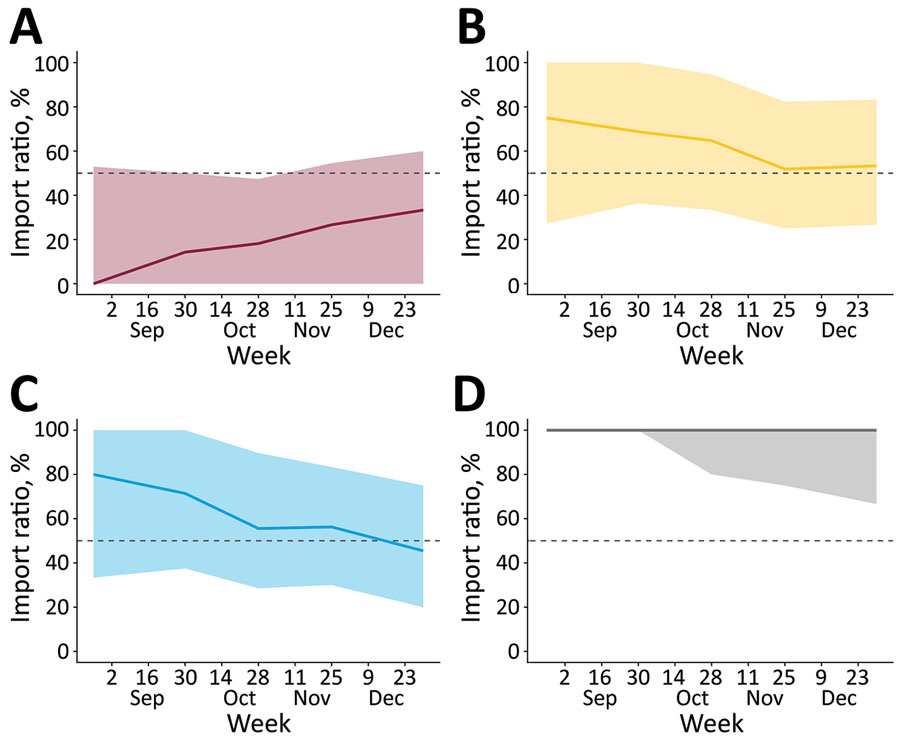
Figure 4. Median ratio of importations to total viral flow from a study of expansion of highly pathogenic avian influenza A(H5N1) clade 2.3.4.4b genotype D1.1 virus across flyway regions, North America, fall 2024. A) Pacific Flyway; B) Central Flyway; C) Mississippi Flyway; D) Atlantic Flyway. Ratios for each flyway were determined by the posterior history of Markov jumps. We show data from September (month of first D1.1 detection) to December of 2025. Values <50% (represented by the dashed line) suggest that a flyway is exporting more than importing (a source flyway), whereas values >50% indicate that a flyway is importing more than exporting (a sink flyway). The shaded areas represented 95% highest posterior density regions. Of note, the posterior history of Markov jumps extends well beyond the timeline and becomes sparse. The analysis leveraged sequences from 300 taxa collected from October 2024–March 2025.