Volume 6, Number 2—April 2000
Research
Multivariate Markovian Modeling of Tuberculosis: Forecast for the United States
Sara M. Debanne* , Roger A. Bielefeld*, George M. Cauthen†, Thomas M. Daniel*, and Douglas Y. Rowland
Figure 1
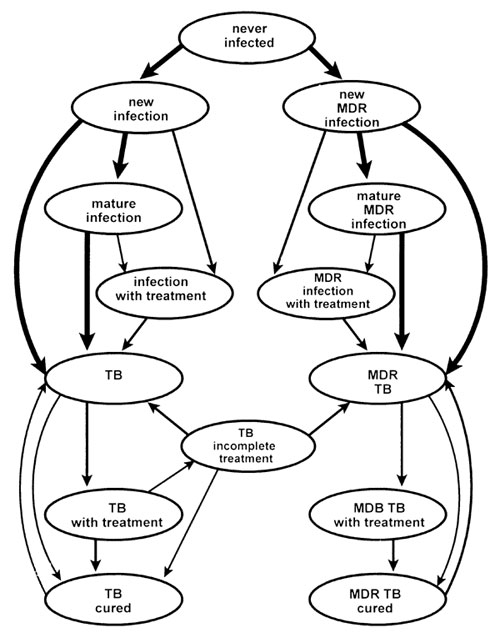
Figure 1. Tuberculosis model states and possible transitions. Thicker lines depict transitions considered in sensitivity analysis.
Page created: December 16, 2010
Page updated: December 16, 2010
Page reviewed: December 16, 2010
The conclusions, findings, and opinions expressed by authors contributing to this journal do not necessarily reflect the official position of the U.S. Department of Health and Human Services, the Public Health Service, the Centers for Disease Control and Prevention, or the authors' affiliated institutions. Use of trade names is for identification only and does not imply endorsement by any of the groups named above.