Volume 7, Number 3—June 2001
Synopsis
Spoligotype Database of Mycobacterium tuberculosis: Biogeographic Distribution of Shared Types and Epidemiologic and Phylogenetic Perspectives
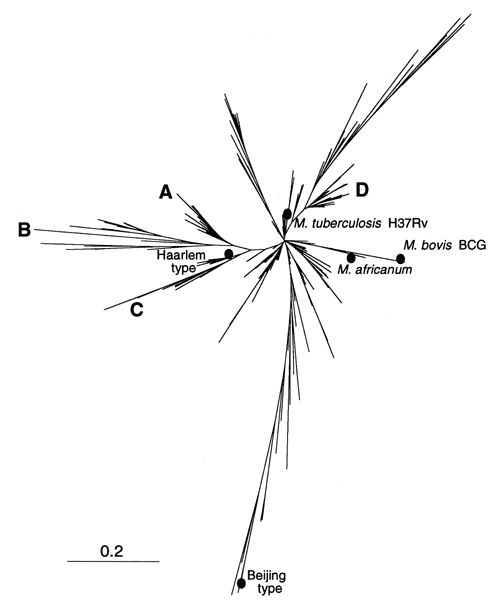
Figure 2

Figure 2. . Phylogenetic tree of shared types of Mycobacterium tuberculosis constructed by pairwise comparison of patterns using the "1-Jaccard" index and the neighbor-joining algorithm. Approximately 15 branches may be visualized at an arbitrary distance of 0.2. The position of some reference strains (M. tuberculosis H37Rv, M. bovis BCG) or well-studied spoligotyping families of isolates (Beijing, Haarlem, and the M. africanum group) are also indicated.
1For this purpose, the independent sampling sizes for Europe and the USA were taken as n1 and n2, the number of individuals within a given shared-type "x" was k1 and k2, and in this case, the representativeness of the two samples was p1=k1/n1 and P2=k2/n2, respectively. To assess if the divergence observed between p1 and p2 was due to sampling bias or the existence of two distinct populations, the percentage of individuals (p0) harboring shared-type "x" in the population studied was estimated by the equation p0= k1+k2/n1+n2=n1p1+n2p2/n1+n2. The distribution of the percentage of shared-type "x" in the sample sizes n1 and n2 follows a normal distribution with a mean p0 and a standard deviation of  and
and  respectively, and the difference d=p1-p2 follows a normal distribution of mean p0-p0=0 and of variance σd2=σp12+σp22 = p0q0/n1+p0q0/n2 or σd2=p0q0 (1/n1+1/n2). The two samples being independent, the two variances were additive; the standard deviation σd=
 . If the absolute value of the quotient d/σd<2, the two samples were considered to belong to a same population (CI 95%) and the variation observed in the distribution of isolates for given shared types could be due to a sampling bias. Inversely, if d/σd>2, then the differences observed in the distribution of isolates for given shared types were statistically significant and not due to potential sample bias.