Volume 7, Number 7—June 2001
THEME ISSUE
International Conference on Emerging Infectious Diseases 2000
Conference Presentations
Epidemiology, Evolution, and Future of the HIV/AIDS Pandemic
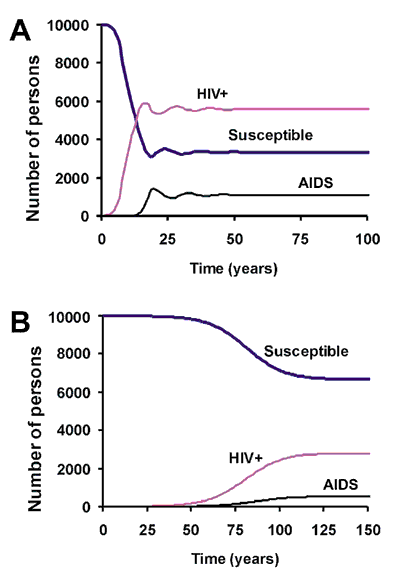
Figure 1

Figure 1. . The spread of HIV/AIDS in a steady population of 10,000. In this figure, HIV-positive includes all persons infected with this virus, but not manifesting the symptoms of AIDS. In this simulation, the four stages of the infection, 0, 1, 2, and 3 are, respectively, 4, 6, 520, and 104 weeks (L0 = 4, L1 = 6, L2 = 520, and L3 = 104). We assume that HIV is not transmitted during the first 4 weeks, stage 0. A) In a wholly susceptible host population during each stage 1, 2, and 3, infected host will be responsible for one secondary infection, R01 = 0, R01 = R02 = R03 = 1.0. B) ) In a wholly susceptible host population during stages 1, 2, and 3, each infected host will be responsible for one secondary infection, R01 = 0, R01 = R02 = R03 = 0.50.