Landscape Epidemiology of Tularemia Outbreaks in Sweden
Kerstin Svensson, Erik Bäck, Henrik Eliasson, Lennart Berglund, Malin Granberg, Linda Karlsson, Pär Larsson, Mats Forsman, and Anders Johansson
Author affiliations: Swedish Defense Research Agency, Umeå, Sweden (K. Svensson, M. Granberg, L. Karlsson, P. Larsson, M. Forsman, A. Johansson); Umeå University, Umeå (K. Svensson, A. Johansson); Örebro University Hospital, Örebro, Sweden (E. Bäck, H. Eliasson); Ljusdal Healthcare Centre, Ljusdal, Sweden (L. Berglund); Umeå University Hospital, Umeå (A. Johansson)
Main Article
Figure 8
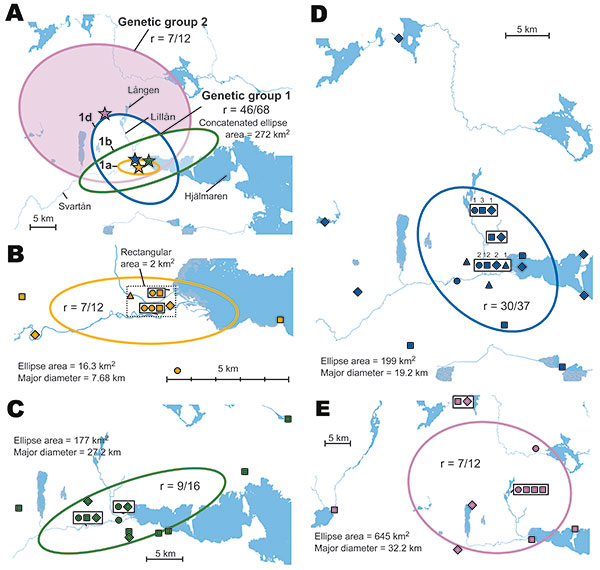
Figure 8. A) Directional distributions and spatial mean centers for 80 Francisella tularensis isolates of 4 different genetic groups, Örebro, Sweden. Each colored ellipse represents a 1 standard deviation distribution around the mean centers of occurrence (starred) for a genetic group. B–E) Details on transmission sites in Örebro for genetic groups of F. tularensis isolates: B) genetic group 1a; C) genetic group 1b; D) genetic group 1d; E) genetic group 2. Patient self-estimates of the spatial data quality are shown as certain (circle), probable (square), or possible (diamond); patient residency (triangle) was used if no such data were available. Proportions (r) of transmission sites within/outside an ellipse are indicated. Numbers above symbols in panel D indicate multiple data points at the same place.
Main Article
Page created: December 09, 2010
Page updated: December 09, 2010
Page reviewed: December 09, 2010
The conclusions, findings, and opinions expressed by authors contributing to this journal do not necessarily reflect the official position of the U.S. Department of Health and Human Services, the Public Health Service, the Centers for Disease Control and Prevention, or the authors' affiliated institutions. Use of trade names is for identification only and does not imply endorsement by any of the groups named above.