Volume 12, Number 9—September 2006
Research
Genomic Signatures of Human versus Avian Influenza A Viruses
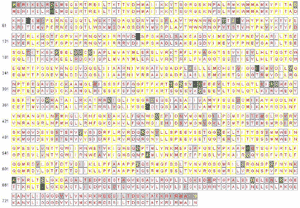
Figure A1

Figure A1. Entropy plot for all 11 influenza proteins for human (top) versus avian (bottom). In each aligned position, we have a consensus residue for 95 avian strains displayed on top, and a consensus residue for 306 human strains at the bottom. Completely conserved amino acid positions are filled with white, while less conserved amino acids are filled in various gray shadings. Positions where one single residue dominates over 90%, less than 90% but greater than 75%, and less than 75% are labeled with red, yellow, and green letters, respectively. Yellow rectangles indicate that both human and avian flu are completely conserved to the same residue, while rectangles in magenta indicate that avian and human flu each completely conserves to a different residue Additional plots for HA, NA, NS1 and NS2, for using different counts of human or avian strains are detailed as individual captions to these plots. Adobe Acrobat PDF available at http://wwwnc.cdc.gov/eid/pdfs/06-0276-FA1.pdf (21 pages).
1These authors contributed equally to this article.