Volume 12, Number 9—September 2006
Research
Genomic Signatures of Human versus Avian Influenza A Viruses
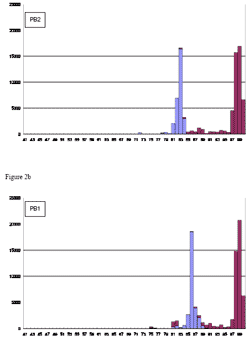
Figure A2

Figure A2. Histograms on comparing 306 human versus 95 avian influenza A viruses, based on nucleotide pairwise sequence identities. Vertical axis shows the count for pairs of sequences with specific percent identity (rounded to integer). Red bars represent frequencies for 'homo' pairs – sequences of the same host species (human to human, or avian to avian); blue bars represent frequencies for 'hetero' pairs – pairs that cross host species (human to avian, or avian to human). Adobe Acrobat PDF available at http://wwwnc.cdc.gov/eid/pdfs/06-0276-FA2.pdf (6 pages).
1These authors contributed equally to this article.
Page created: November 18, 2011
Page updated: November 18, 2011
Page reviewed: November 18, 2011
The conclusions, findings, and opinions expressed by authors contributing to this journal do not necessarily reflect the official position of the U.S. Department of Health and Human Services, the Public Health Service, the Centers for Disease Control and Prevention, or the authors' affiliated institutions. Use of trade names is for identification only and does not imply endorsement by any of the groups named above.