Volume 18, Number 12—December 2012
Research
Transmission Routes for Nipah Virus from Malaysia and Bangladesh
Bronwyn A. Clayton, Deborah Middleton, Jemma Bergfeld, Jessica Haining, Rachel Arkinstall, Linfa Wang, and Glenn A. Marsh
Figure 2
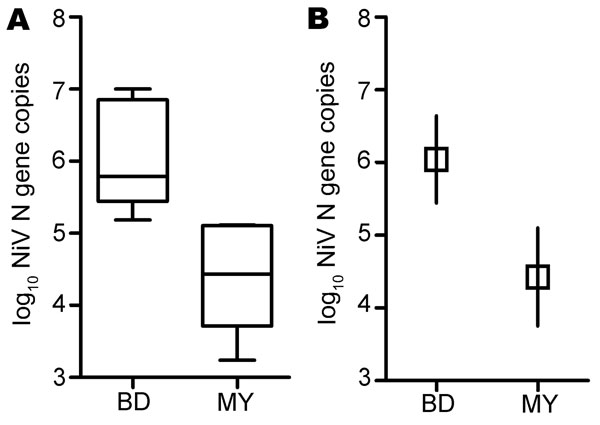
Figure 2. . . Oral shedding of Nipah virus (NiV) in experimentally infected ferrets. A) Results of viral RNA area under the curve (AUC) calculation. Lower margin, inner line, and upper margin of the boxes represent 25th percentiles, medians, and 75th percentiles, respectively. Whiskers show maximum and minimum values for each group. B) Comparison of mean AUC between NiV-Bangladesh and NiV-Malaysia. Mean AUC for the NiV-Bangladesh infection group was significantly higher than that for the NiV-Malaysia–infected group; p = 0.001. Interval bars represent 95% CIs for the means. BD, Bangladesh; MY, Malaysia.
Page created: November 20, 2012
Page updated: November 20, 2012
Page reviewed: November 20, 2012
The conclusions, findings, and opinions expressed by authors contributing to this journal do not necessarily reflect the official position of the U.S. Department of Health and Human Services, the Public Health Service, the Centers for Disease Control and Prevention, or the authors' affiliated institutions. Use of trade names is for identification only and does not imply endorsement by any of the groups named above.