Skip directly to site content Skip directly to page options Skip directly to A-Z link Skip directly to A-Z link Skip directly to A-Z link
Volume 20, Number 1—January 2014
Research

Dynamic Modeling of Cost-effectiveness of Rotavirus Vaccination, Kazakhstan

Birgitte Freiesleben de BlasioComments to Author , Elmira Flem, Renat Latipov, Ajnagul Kuatbaeva, and Ivar Sønbø Kristiansen
Author affiliations: Norwegian Institute of Public Health, Oslo, Norway (B. Freiesleben de Blasio, E. Flem); University of Oslo, Norway (B. Freiesleben de Blasio, I.S. Kristiansen); Research Institute of Virology, Tashkent, Republic of Uzbekistan (R. Latipov); Scientific-Practical Centre of Epidemiologic Surveillance, Almaty, Republic of Kazakhstan (A. Kuatbaeva)

Main Article

Figure 1

Projectedepidemiologic effect of rotavirus vaccination in children <5 years of age in Kazakhstan. A) Estimated daily incidence of severe RVGE (base case scenario) with introduction of rotavirus vaccination in January 2012 in the 5 candidate models. B) Estimated daily incidence of mild RVGE (base case) with introduction of the rotavirus vaccination in January 2012 in the 5 candidate models.  C) Yearly age-specific incidence of severe RVGE pre-vaccination (white) and 10 years postvaccination (g

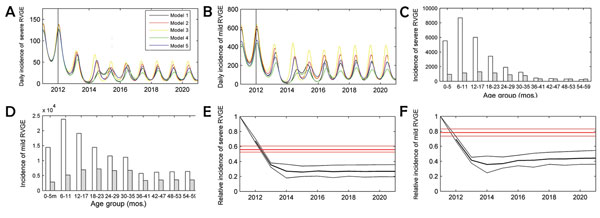
Figure 1. . Projected epidemiologic effect of rotavirus vaccination in children <5 years of age in Kazakhstan. A) Estimated daily incidence of severe RVGE (base case scenario) with introduction of rotavirus vaccination in January 2012 in the 5 candidate models. B) Estimated daily incidence of mild RVGE (base case) with introduction of the rotavirus vaccination in January 2012 in the 5 candidate models. C) Yearly age-specific incidence of severe RVGE pre-vaccination (white) and 10 years postvaccination (gray). D) Yearly age-specific incidence of mild RVGE pre-vaccination (white) and 10 years postvaccination (gray). E) Relative incidence of severe RVGE with vaccination compared with the expected incidence without vaccination; the blue curve shows the mean relative incidence with lower and upper bounds predicted by the synthesis of dynamic models, including both direct and indirect effects, while the red curve shows the relative incidence predicted by a static cohort model incorporating only the direct effects (Technical Appendix). F) Relative incidence of mild RVGE with vaccination compared with the expected incidence without vaccination; the blue curve shows the mean relative incidence with lower and upper bounds in the synthesis of dynamic models; the red curve shows the relative incidence predicted by a static cohort model.

Main Article

Page created: January 03, 2014
Page updated: January 03, 2014
Page reviewed: January 03, 2014
The conclusions, findings, and opinions expressed by authors contributing to this journal do not necessarily reflect the official position of the U.S. Department of Health and Human Services, the Public Health Service, the Centers for Disease Control and Prevention, or the authors' affiliated institutions. Use of trade names is for identification only and does not imply endorsement by any of the groups named above.
file_external