Volume 21, Number 2—February 2015
Research
Quantifying Reporting Timeliness to Improve Outbreak Control
Figure 2
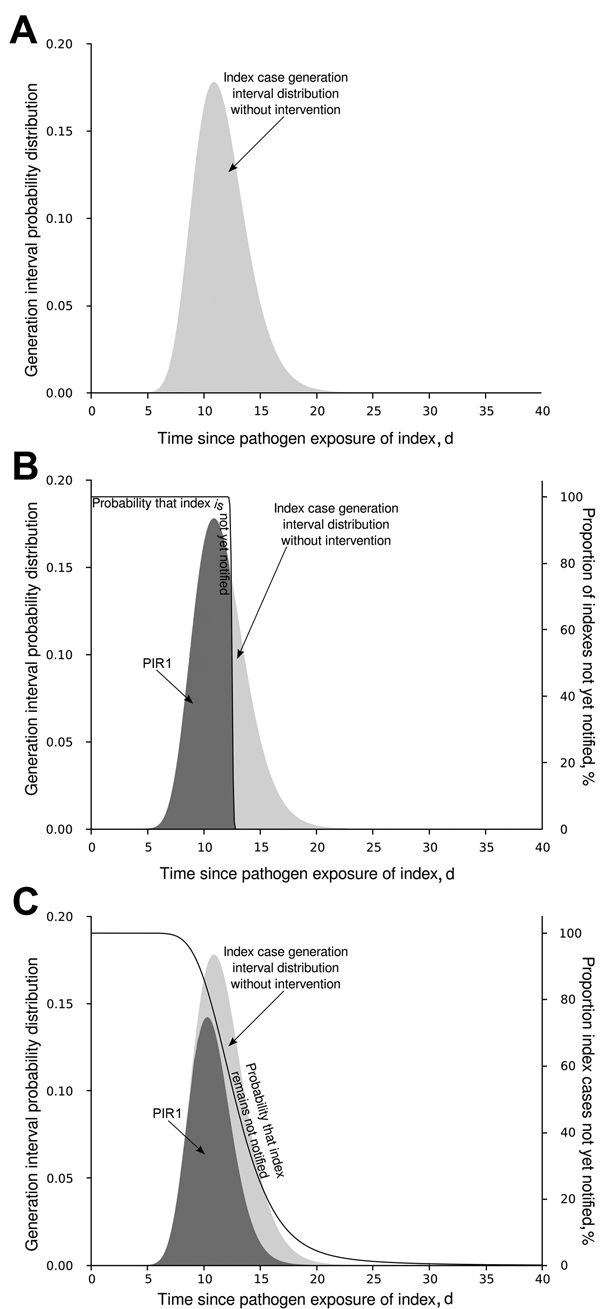
Figure 2. Schematic modification of PIR1. A) Generation interval distribution of an index case as function of time since the index case acquired the pathogen. Without notification and intervention, the proportion of infections expected by the index case is 1, the light gray area under the curve. B) How the generation interval distribution is modified, assuming that all index cases are notified and stopped exactly 13 days after exposure to the pathogen. C) How the average generation interval is modified when index cases are notified and stopped according to a time distribution. Dark gray shading indicates the PIR1 value for each situation. The black line indicates the proportion of index cases not yet notified (right y-axis), equivalent to the probability of an index case not yet being notified in each situation. PIR1, expected proportion of cases caused by index case at notification.