Volume 21, Number 2—February 2015
Research
Quantifying Reporting Timeliness to Improve Outbreak Control
Figure 7
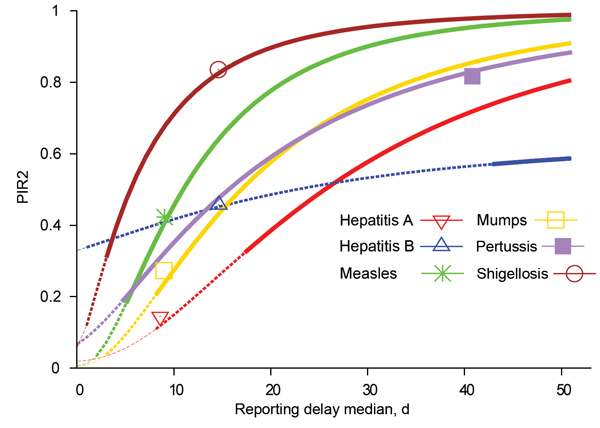
Figure 7. Expected proportion of infections caused by secondary cases before reporting of their index case, depending on reporting delay median for the indicated diseases and assuming standard deviation equal to median value. Thick lines show reporting delay medians for which there is no outbreak control. Intermediate-width dashed lines show reporting delay medians that bring diseases within the upper outbreak condition (R × PIR2<1). Thin dashed lines show reporting delay medians bringing diseases under the lower outbreak control condition (R2 × PIR2<1). Symbols indicate PIR2 evaluated with current reporting delay data. HepA, hepatitis A; hepB, hepatitis B; PIR2, expected proportion of new infections caused by secondary cases before index case is notified; R, reproduction number.