Volume 21, Number 2—February 2015
Research
Quantifying Reporting Timeliness to Improve Outbreak Control
Figure 3
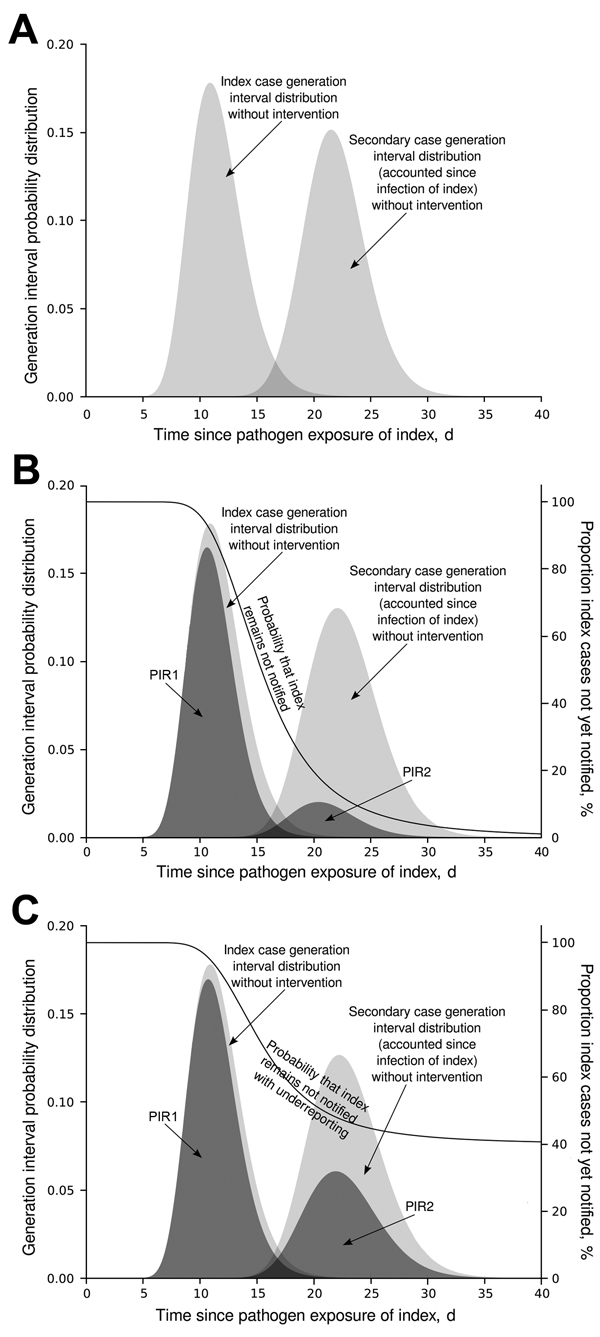
Figure 3. Schematic modification of PIR2. A) Generation interval time distributions of index and secondary cases, from the moment of exposure of the notified index case. PIR2 is represented by the area under the second generation interval distribution, which is 1 in the absence of notification/intervention. B) PIR1 and PIR2 values when index cases are notified and stopped together with their secondary cases, according to a time distribution. C) How PIR values in panel B are modified by 40% underreporting. Dark gray shading indicates PIR1 and PRI2 values. The black line indicates the proportion of index cases not yet notified (right y-axis), equivalent to the probability of an index case not yet being notified in each situation. PIR1, expected proportion of cases caused by index case at notification; PIR2, expected proportion of new infections caused by secondary cases before index case is notified.