Skip directly to site content Skip directly to page options Skip directly to A-Z link Skip directly to A-Z link Skip directly to A-Z link
Volume 22, Number 12—December 2016
Research

Whole-Genome Characterization and Strain Comparison of VT2f-Producing Escherichia coli Causing Hemolytic Uremic Syndrome

Laura GrandeComments to Author , Valeria Michelacci, Roslen Bondì, Federica Gigliucci, Eelco Franz, Mahdi Askari Badouei, Sabine Schlager, Fabio Minelli, Rosangela Tozzoli, Alfredo Caprioli, and Stefano Morabito
Author affiliations: Istituto Superiore di Sanità, Rome, Italy (L. Grande, V. Michelacci, R. Bondi, F. Gigliucci, F. Minelli, R. Tozzoli, A. Caprioli, S. Morabito); National Institute for Public Health and the Environment, Bilthoven, the Netherlands (E. Franz); Faculty of Veterinary Medicine, Garmsar Branch, Islamic Azad University, Garmsar, Iran (M. Askari Badouei); Austrian Agency for Health and Food Safety, Graz, Austria (S. Schlager)

Main Article

Figure 1

Principal component analysis of the virulence profiles of VT2f-producing verotoxigenic Escherichia coli (VTEC) strains isolated from fecal samples from human uncomplicated diarrheal case-patients (orange), human hemolytic uremic syndrome patients (red), and pigeon feces (green). Non-O157 VTEC that do not produce VT2f are indicated in purple. This analysis clusters isolates on the basis of similarities in virulence gene content. Isolates clustering together have similar virulence profiles. Lines

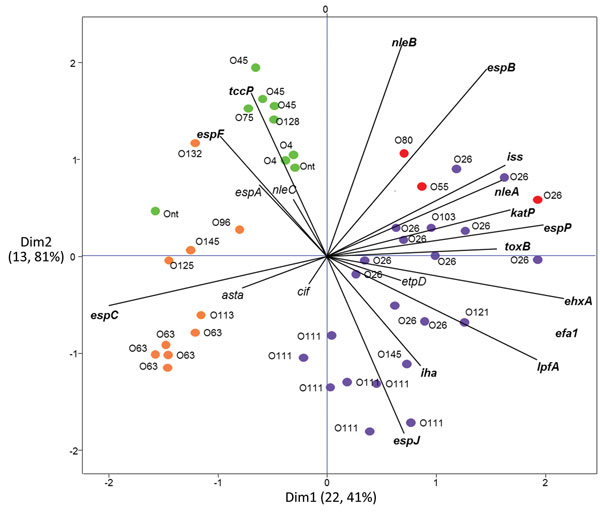
Figure 1. Principal component analysis of the virulence profiles of VT2f-producing verotoxigenic Escherichia coli (VTEC) strains isolated from fecal samples from human uncomplicated diarrheal case-patients (orange), human hemolytic uremic syndrome patients (red), and pigeon feces (green). Non-O157 VTEC that do not produce VT2f are indicated in purple. This analysis clusters isolates on the basis of similarities in virulence gene content. Isolates clustering together have similar virulence profiles. Lines represent individual virulence genes. The projected length of the lines on the horizontal and vertical axes indicates the strength of the contribution of a specific virulence marker to the separation of clusters. Dim1 and Dim2 represent the first 2 dimensions of the analysis and indicate the fraction of variation in the dataset that can be explained by the included variables (i.e., virulence genes).

Main Article

Page created: November 17, 2016
Page updated: November 17, 2016
Page reviewed: November 17, 2016
The conclusions, findings, and opinions expressed by authors contributing to this journal do not necessarily reflect the official position of the U.S. Department of Health and Human Services, the Public Health Service, the Centers for Disease Control and Prevention, or the authors' affiliated institutions. Use of trade names is for identification only and does not imply endorsement by any of the groups named above.
file_external