Volume 22, Number 3—March 2016
Synopsis
Avian Influenza A(H5N1) Virus in Egypt
Ghazi Kayali , Ahmed Kandeil, Rabeh El-Shesheny, Ahmed S. Kayed, Asmaa M. Maatouq, Zhipeng Cai, Pamela McKenzie, Richard Webby, Samir El Refaey, Amr Kandeel, and Mohamed A. Ali
Figure 5
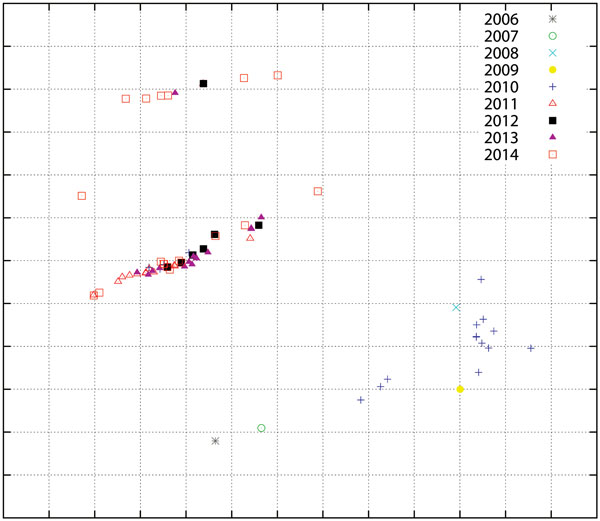
Figure 5. Antigenic cartography of reactivity of highly pathogenic avian influenza A(H5N1) virus isolates from Egypt, 2006–2014. The map was produced by using hemagglutination inhibition assay data generated with a panel of monoclonal antibodies and by using AntigenMap (http://sysbio.cvm.msstate.edu/AntigenMap). One unit (grid) represents a 2-fold change in the assay results. Each mark on the map represents results for 1 isolate.
Page created: February 16, 2016
Page updated: February 16, 2016
Page reviewed: February 16, 2016
The conclusions, findings, and opinions expressed by authors contributing to this journal do not necessarily reflect the official position of the U.S. Department of Health and Human Services, the Public Health Service, the Centers for Disease Control and Prevention, or the authors' affiliated institutions. Use of trade names is for identification only and does not imply endorsement by any of the groups named above.