Skip directly to site content Skip directly to page options Skip directly to A-Z link Skip directly to A-Z link Skip directly to A-Z link
Volume 22, Number 5—May 2016
Research

Differences in Genotype, Clinical Features, and Inflammatory Potential of Borrelia burgdorferi sensu stricto Strains from Europe and the United States

Tjasa Cerar1, Franc Strle1, Dasa Stupica, Eva Ruzic-Sabljic, Gail McHugh, Allen C. Steere, and Klemen StrleComments to Author 
Author affiliations: University of Ljubljana, Ljubljana, Slovenia (T. Cerar, E. Ruzic-Sabljic); University Medical Center, Ljubljana (F. Strle, D. Stupica); Massachusetts General Hospital, Boston, Massachusetts, USA (G. McHugh, A.S. Steere, K. Strle)

Main Article

Figure 2

Phylogenetic analysis of Borrelia burgdorferi sensu stricto strains from central Europe (Slovenia) and the United States. A) Minimum spanning tree analysis of 70 isolates included in this study. Sequence types (STs) are indicated by numbers, and outer surface protein types are indicated by letters. Sizes of circles indicate ST sample sizes. Lengths of lines connecting STs indicate extent of variation (order of certainty) (no. locus variants). STs connected by the shortest black line are single-l

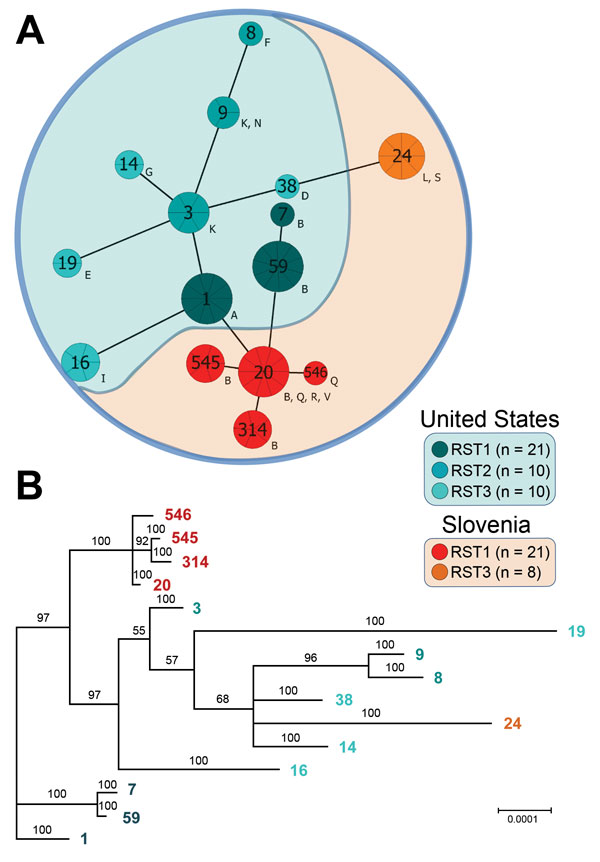
Figure 2. Phylogenetic analysis of Borrelia burgdorferi sensu stricto strains from central Europe (Slovenia) and the United States. A) Minimum spanning tree analysis of 70 isolates included in this study. Sequence types (STs) are indicated by numbers, and outer surface protein types are indicated by letters. Sizes of circles indicate ST sample sizes. Lengths of lines connecting STs indicate extent of variation (order of certainty) (no. locus variants). STs connected by the shortest black line are single-locus variants. Letters outside circles indicate OspC types. RST, ribosomal RNA intergenic spacer. B) Bayesian consensus tree resulting from simultaneous analysis of concatenated sequences of 8 housekeeping genes (clpA, clpX, nifS, pepX, pyrG, recG, rplB, and uvrA). Values at nodes indicate Bayesian posterior probabilities (proportion of sampled trees containing the taxon bipartition). Scale bar indicates nucleotide substitutions per site.

Main Article

1These authors contributed equally to this article.

Page created: April 13, 2016
Page updated: April 13, 2016
Page reviewed: April 13, 2016
The conclusions, findings, and opinions expressed by authors contributing to this journal do not necessarily reflect the official position of the U.S. Department of Health and Human Services, the Public Health Service, the Centers for Disease Control and Prevention, or the authors' affiliated institutions. Use of trade names is for identification only and does not imply endorsement by any of the groups named above.
file_external