Skip directly to site content Skip directly to page options Skip directly to A-Z link Skip directly to A-Z link Skip directly to A-Z link
Volume 23, Number 3—March 2017
Research

Whole-Genome Analysis of Bartonella ancashensis, a Novel Pathogen Causing Verruga Peruana, Rural Ancash Region, Peru

Kristin E. Mullins12Comments to Author , Jun Hang2, Robert J. Clifford2, Fatma Onmus-Leone, Yu Yang, Ju Jiang, Mariana Leguia, Matthew R. Kasper, Ciro Maguina, Emil P. Lesho, Richard G. Jarman, Allen L. Richards, and David Blazes
Author affiliations: Uniformed Services University of the Health Sciences, Bethesda, Maryland, USA (K.E. Mullins, J. Jiang, A. Richards, D. Blazes); US Naval Medical Research Center, Silver Spring, Maryland, USA (K.E. Mullins, A. Richards); Walter Reed Army Institute of Research, Silver Spring (J. Hang, R.J. Clifford, F. Onmus-Leone, Y. Yang, E.P. Lesho, R.G. Jarman); US Naval Medical Research Unit No. 6, Lima, Peru (M. Leguia, M.R. Kasper); Universidad Peruana Cayetano Heredia, Lima (C. Maguina)

Main Article

Figure 1

Alignment of whole-genome restriction maps and in silico map for Bartonella isolates from patients with verruga peruana, rural Ancash region, Peru. A) Maps for B. ancashensis isolates 20.00, 20.60, and 41.60 were determined by using optical mapping. Shaded areas indicate regions of alignment, unshaded areas indicate regions where restriction maps do not align, and black horizontal arrow indicates restriction sites. B) Phylogeny based on map similarity constructed by using the unweighted pair gro

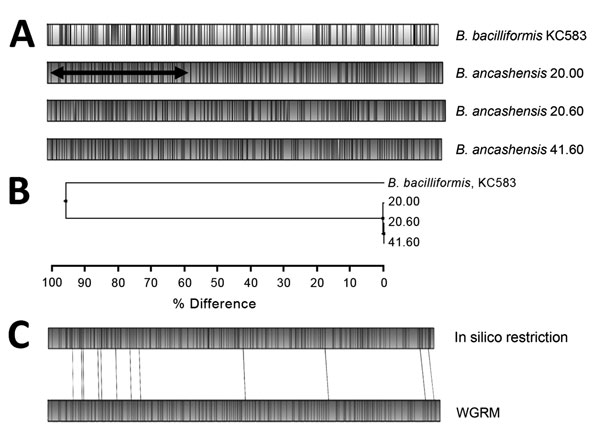
Figure 1. Alignment of whole-genome restriction maps and in silico map for Bartonella isolates from patients with verruga peruana, rural Ancash region, Peru. A) Maps for B. ancashensis isolates 20.00, 20.60, and 41.60 were determined by using optical mapping. Shaded areas indicate regions of alignment, unshaded areas indicate regions where restriction maps do not align, and black horizontal arrow indicates restriction sites. B) Phylogeny based on map similarity constructed by using the unweighted pair group method with arithmetic mean. C) Alignment of map for B. ancashensis predicted in silico from the complete genome sequence with the experimentally observed B. ancashensis map. WGRM, whole-genome restriction map.

Main Article

1Current affiliation: University of Maryland, Baltimore, Maryland, USA.

2These authors contributed equally to this article.

Page created: February 17, 2017
Page updated: February 17, 2017
Page reviewed: February 17, 2017
The conclusions, findings, and opinions expressed by authors contributing to this journal do not necessarily reflect the official position of the U.S. Department of Health and Human Services, the Public Health Service, the Centers for Disease Control and Prevention, or the authors' affiliated institutions. Use of trade names is for identification only and does not imply endorsement by any of the groups named above.
file_external