Volume 23, Number 6—June 2017
Research
Genomic Analysis of Salmonella enterica Serovar Typhimurium DT160 Associated with a 14-Year Outbreak, New Zealand, 1998–2012
Samuel J. Bloomfield , Jackie Benschop, Patrick J. Biggs1, Jonathan C. Marshall1, David T.S. Hayman1, Philip E. Carter1, Anne C. Midwinter, Alison E. Mather, and Nigel P. French
Figure 3
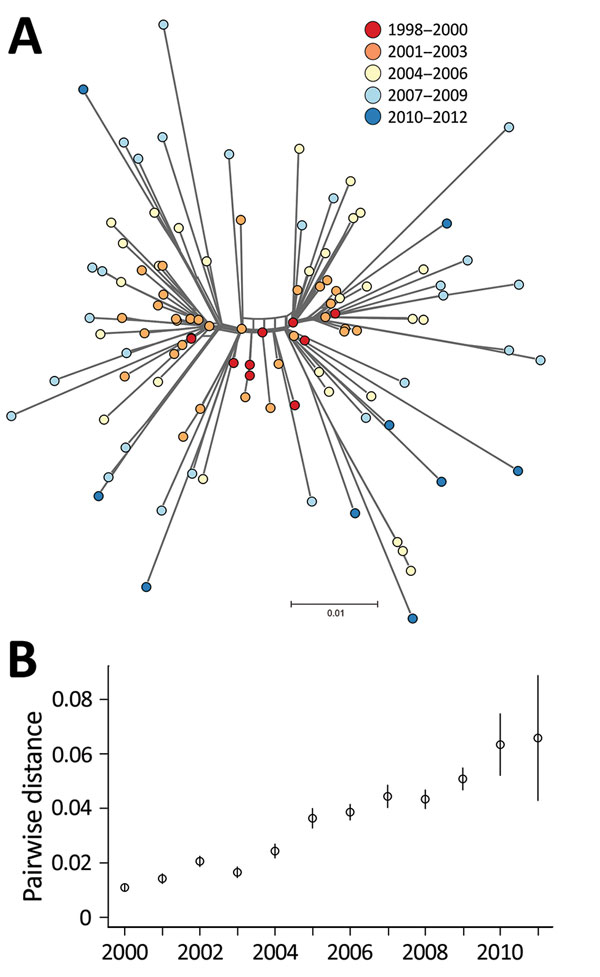
Figure 3. A) NeighborNet tree of 109 Salmonella enterica serovar Typhimurium DT160 isolates collected during an outbreak in New Zealand, 1998–2012. The tree was based on 793 core single-nucleotide polymorphisms. Colors indicate date of isolate collection. The scale bar represents the number of nucleotide substitutions per site. B) Scatterplot of the mean pairwise distance of 106 DT160 isolates from 2000–2011. Error bars represent 95% CIs.
1These authors contributed equally to this article.
Page created: May 16, 2017
Page updated: May 16, 2017
Page reviewed: May 16, 2017
The conclusions, findings, and opinions expressed by authors contributing to this journal do not necessarily reflect the official position of the U.S. Department of Health and Human Services, the Public Health Service, the Centers for Disease Control and Prevention, or the authors' affiliated institutions. Use of trade names is for identification only and does not imply endorsement by any of the groups named above.