Volume 23, Number 6—June 2017
Research
Genomic Analysis of Salmonella enterica Serovar Typhimurium DT160 Associated with a 14-Year Outbreak, New Zealand, 1998–2012
Figure 4
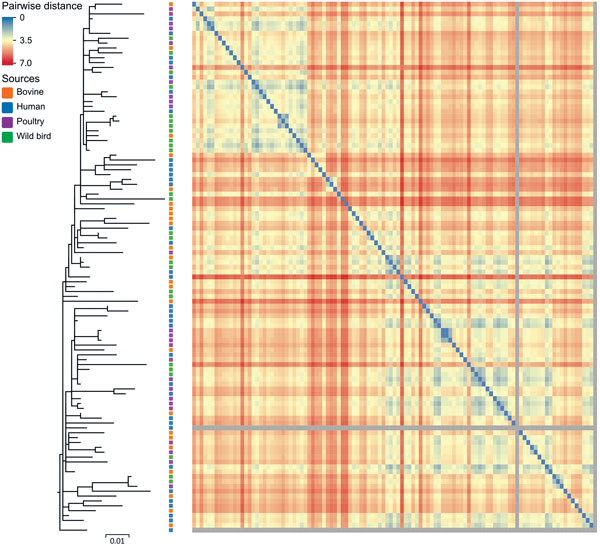
Figure 4. Maximum-likelihood tree of 109 Salmonella enterica serovar Typhimurium DT160 isolates collected during an outbreak in New Zealand, 1998–2012. The tree was based on 793 core single-nucleotide polymorphisms. Colored squares to the right of the branches indicate the source of isolates. The scale bar represents number of nucleotide substitutions per site. The heat map represents the Euclidean pairwise distance between isolates (based on the presence of 684 protein differences). Isolates that shared a small number of protein differences contained small Euclidean distances and are closer to blue in color on the heat map; isolates that shared a large number of protein differences contained large Euclidean distances and are closer to red in color. The gray squares represent the 2 outliers missing a large number of genes. The diagonal array of blue squares represents the pairwise distance for the same isolates.
1These authors contributed equally to this article.