Volume 23, Number 6—June 2017
Research
Genomic Analysis of Salmonella enterica Serovar Typhimurium DT160 Associated with a 14-Year Outbreak, New Zealand, 1998–2012
Samuel J. Bloomfield , Jackie Benschop, Patrick J. Biggs1, Jonathan C. Marshall1, David T.S. Hayman1, Philip E. Carter1, Anne C. Midwinter, Alison E. Mather, and Nigel P. French
Figure 5
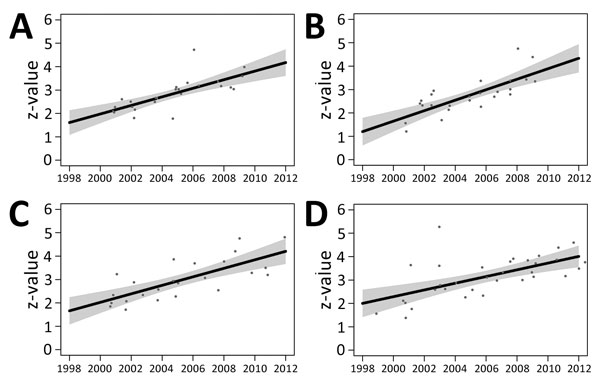
Figure 5. Scatter plots of year of collection versus z-values for 107 Salmonella enterica serovar Typhimurium DT160 isolates collected during an outbreak in New Zealand, 1998–2012. Of the 107 isolates, 25 were from poultry (A), 25 from wild birds (B), 24 from bovids (C), and 33 from humans (D). Black lines represent the regression equation; gray shading represents SE for this equation. Date of collection was significantly associated with z-values in this model (p<2−16). There was insufficient evidence to suggest that source was associated with z-values (p = 0.558), and the interaction between source and date of collection was not significant (p = 0.458).
1These authors contributed equally to this article.
Page created: May 16, 2017
Page updated: May 16, 2017
Page reviewed: May 16, 2017
The conclusions, findings, and opinions expressed by authors contributing to this journal do not necessarily reflect the official position of the U.S. Department of Health and Human Services, the Public Health Service, the Centers for Disease Control and Prevention, or the authors' affiliated institutions. Use of trade names is for identification only and does not imply endorsement by any of the groups named above.