Volume 25, Number 4—April 2019
Research
Differences in Neuropathogenesis of Encephalitic California Serogroup Viruses
Figure 2
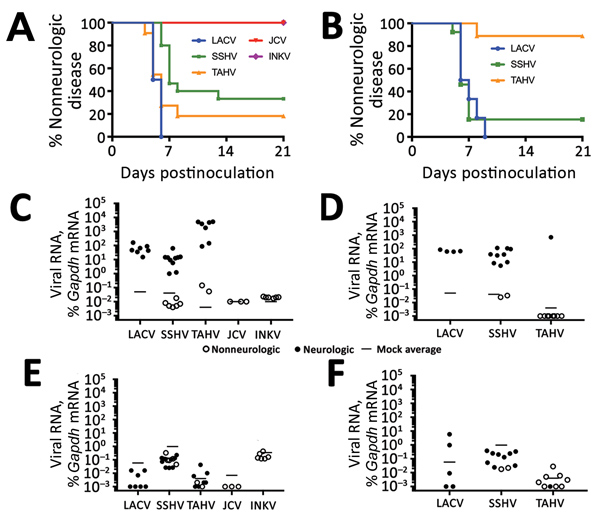
Figure 2. Neuroinvasiveness of California serogroup (CSG) viruses in weanling C57BL/6 mice after intraperitoneal inoculation in study of neuropathogenesis. We inoculated 5–15 mice per group with 105 PFU of each virus (A) and 6–13 mice per group with 103 PFU of LACV, SSHV, or TAHV (B). Brains and spleens of mice were collected at the experimental endpoint and evaluated for viral RNA by quantitative reverse transcription PCR with virus-specific primers. The average of 3 mock controls is reported for each primer set. The viral RNA level in each sample was calculated as the difference in the percentage in cycle threshold (Ct): Ct for Gapdh mRNA minus Ct for viral mRNA. Viral RNA was plotted as the percentage of gene expression relative to that of the Gapdh gene. Viral RNA in brains of mice inoculated with 105 PFU of each virus (C) or 103 PFU of LACV, SSHV, and TAHV (D). Viral RNA in spleens of mice inoculated with 105 PFU of each virus (E) or 103 PFU of LACV, SSHV, and TAHV (F). Gapdh, glyceraldehyde 3-phosphate dehydrogenase; INKV, Inkoo virus; JCV, Jamestown Canyon virus; LACV, La Crosse virus; SSHV, snowshoe hare virus; TAHV, Tahyna virus.