Volume 25, Number 4—April 2019
Research
Differences in Neuropathogenesis of Encephalitic California Serogroup Viruses
Figure 5
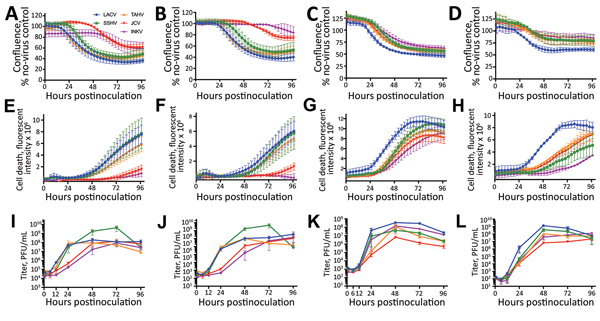
Figure 5. Cytotoxicity and viral replication kinetics assays of California serogroup (CSG) viruses in SH-SY5Y cells and human neural stem cells (hNSCs) for up to 96 hours postinoculation in study of neuropathogenesis. SH-SY5Y cells were infected at a multiplicity of infection of 0.1 (A, E, I) or 0.01 (B, F, J), and hNSCs were infected at a multiplicity of infection of 0.01 (C, G, K) or 0.001 (D, H, L). A–D) Confluence was measured over time on the IncuCyte (Essen Bioscience, https://www.essenbioscience.com) as the percentage of the image covered by cells. Graphs show the percentage of confluence compared with that of uninfected control wells. E–H) Cell death was measured over time with the IncuCyte and reported as the total integrated fluorescent intensity of the Cytotox Green (Essen Bioscience) reagent. I–L) Supernatants were harvested from SH-SY5Y cells and hNSCs at 1, 6, 12, 24, 48, 72, and 96 hours postinfection and titered on Vero cells by plaque assay. All error bars indicate SEM. PFU, plaque-forming units.