Volume 25, Number 6—June 2019
Research
Performance of 2 Commercial Serologic Tests for Diagnosing Zika Virus Infection
Séverine Matheus, Cheikh Talla, Bhety Labeau, Franck de Laval, Sébastien Briolant, Lena Berthelot, Muriel Vray, and Dominique Rousset
Figure 1
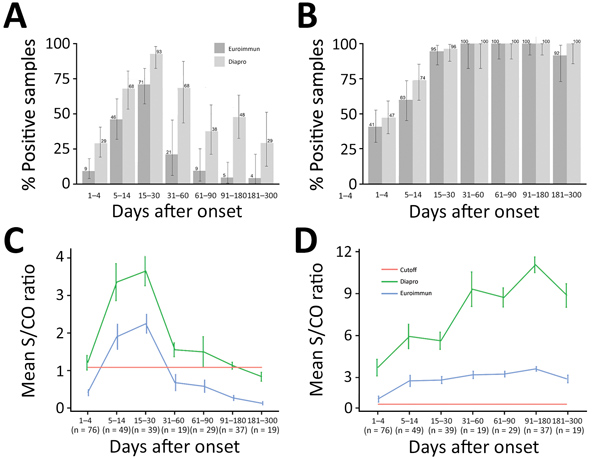
Figure 1. Kinetics of Zika virus IgM and IgG as determined with Euroimmun and Dia.Pro kits for patient samples collected in the first 10 months after infection, by time interval. A, B) Percent positive for Zika virus IgM (A) and IgG (B). Values are given with binomial proportion CI). C, D) Overall time course of mean signal-to-cutoff ratios of Zika virus IgM (C) and IgG (D). Values are shown with SEs. The number of patients sampled is provided for each time interval.
Page created: May 20, 2019
Page updated: May 20, 2019
Page reviewed: May 20, 2019
The conclusions, findings, and opinions expressed by authors contributing to this journal do not necessarily reflect the official position of the U.S. Department of Health and Human Services, the Public Health Service, the Centers for Disease Control and Prevention, or the authors' affiliated institutions. Use of trade names is for identification only and does not imply endorsement by any of the groups named above.