Volume 26, Number 3—March 2020
Research
Stable and Local Reservoirs of Mycobacterium ulcerans Inferred from the Nonrandom Distribution of Bacterial Genotypes, Benin
Figure 2
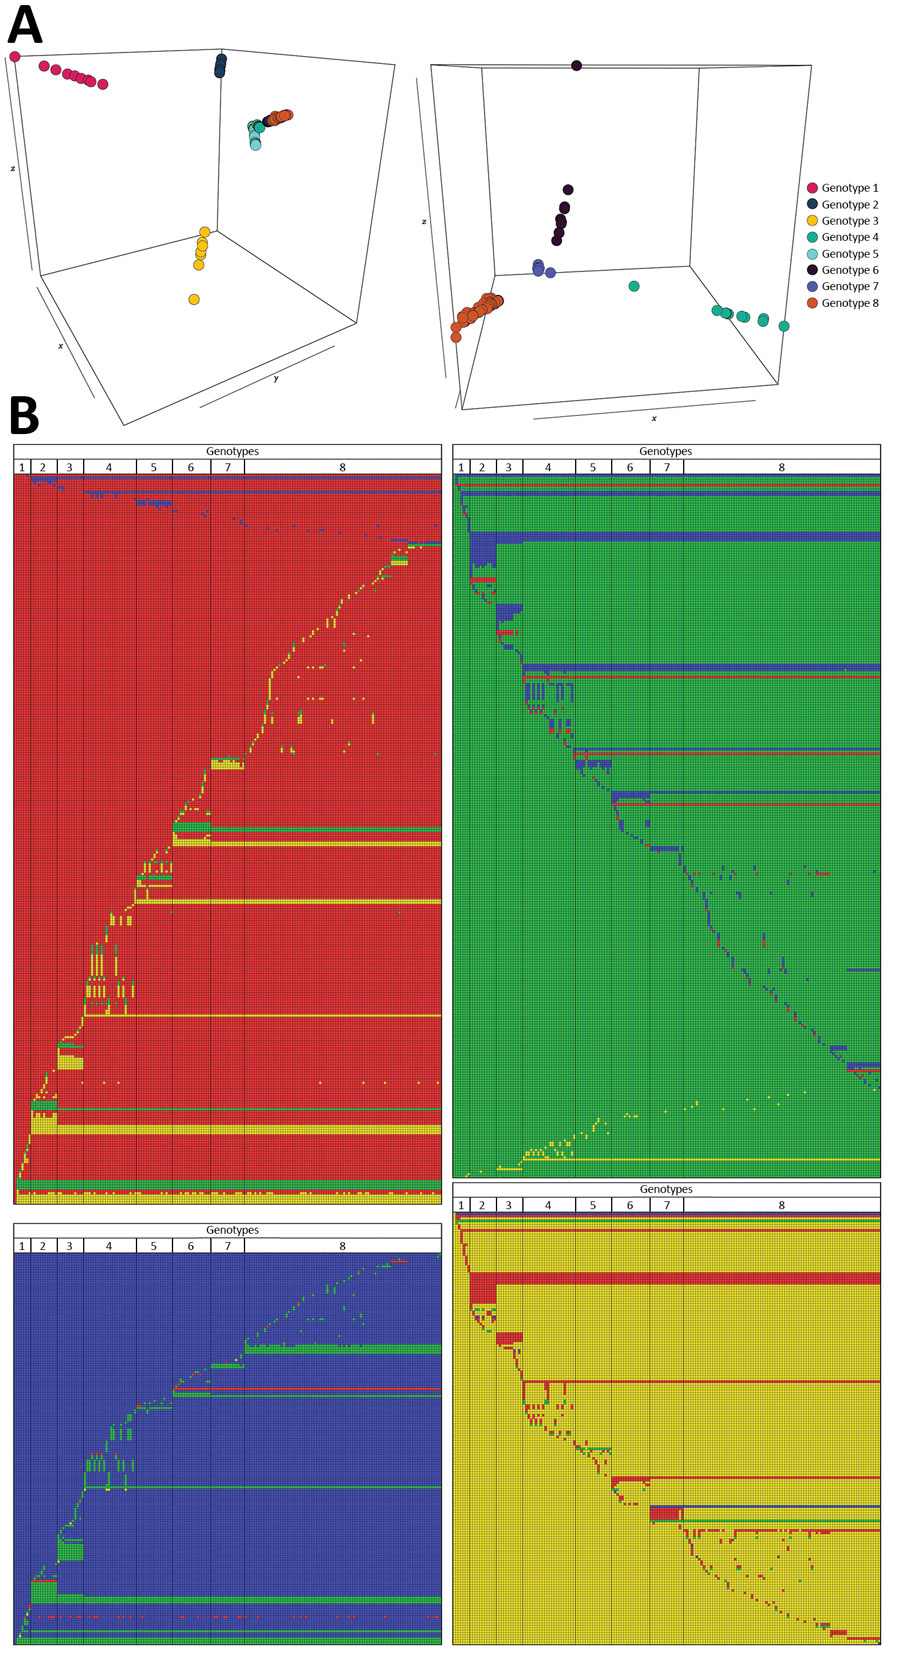
Figure 2. Graphical representations of the 8 Mycobacterium ulcerans genomes and their 940 single-nucleotide polymorphisms from Buruli ulcer patients in Benin and Nigeria. A) Principal component analysis (PCA) projection on the first 3 principal components with 8 groups of genomes clustering together, which we defined as genotypes. PCA was performed based on the Eigenstrat algorithm but applied to a haploid organism. Image on the left displays a PCA performed on all 174 genomes; image on the right displays a PCA performed after removing genomes from the first 3 genotypes (shown for better visualization of genome clustering). Axes x, y, and z represent the principal components 1, 2, and 3, respectively; inertia was 7% for component 1, 5% for component 2, and 4% for component 3. B) Graphical representation of the 940 single-nucleotide polymorphisms specific to the 8 genotypes, showing interdifferences and intradifferences of all genomes. Each line represents 1 genomic position, and each column represents 1 M. ulcerans genome. A color code has been chosen for each nucleotide (blue, adenine; green, guanine; red, cytosine; yellow, thymine). Each representation has been ordered and referenced against the genome 1232–13 belonging to genotype 1 (first column).