Volume 26, Number 8—August 2020
Research
Population Genomic Structure and Recent Evolution of Plasmodium knowlesi, Peninsular Malaysia
Figure 5
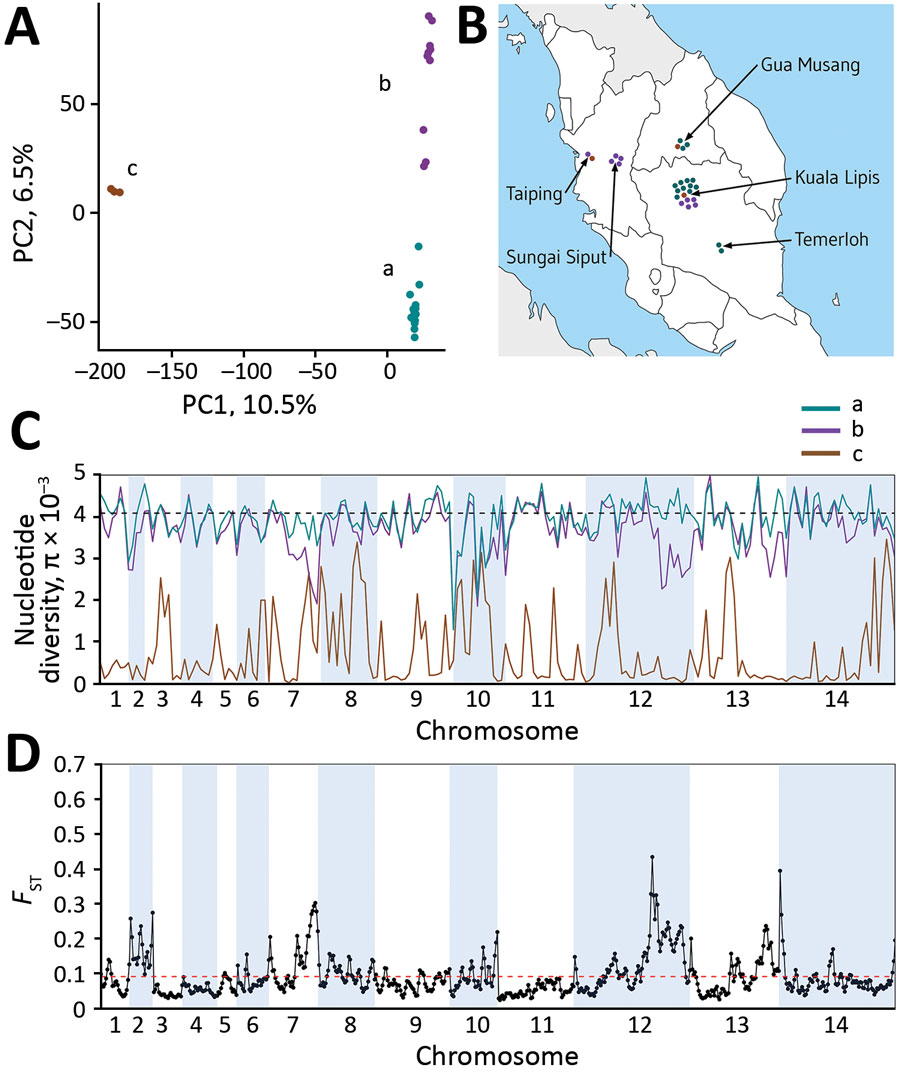
Figure 5. Plasmodium knowlesi cluster 3 clinical isolates forming genomic subpopulations that co-occur locally, Peninsular Malaysia. A) Principal component analysis of the 28 cluster 3 P. knowlesi clinical isolates from Peninsular Malaysia, showing clustering into 3 groups: subclusters A (15 isolates), B (10 isolates), and C (3 isolates). The assignment of all samples to these 3 subclusters is completely consistent with their placement in the within-cluster 3 branching of the neighbor-joining tree based on the pairwise distance matrix (Figure 2, panel A). The first principal component accounts for 10.5% of overall variation and separated subcluster 3 from the others, whereas the second principal component accounts for 6.5% of overall variation and separated subclusters A and B. B). Each of the cluster 3 P. knowlesi subclusters was detected at multiple sites within peninsular Malaysia (points shown at each of the 5 sampling sites show individual infections with colors for the different subclusters as in panel A). The site with most samples had all 3 subclusters co-occurring locally. C) Genomewide scan of diversity shows that the subcluster C samples are virtually identical in large parts of the genome, whereas subclusters A and B are both highly diverse throughout the genome, with only a few genomic regions showing lower diversity in subcluster B compared with A (in chromosomes 2, 7, 12, and 13). D) Genomewide scan of differentiation between subclusters A and B by sliding window between-population fixation index analysis shows peaks of differentiation corresponding to regions with differences in diversity. Most notable is a large region of chromosome 12 having many windows with between-population fixation index values >0.2 and containing some individual single-nucleotide polymorphisms with fixed differences (Appendix 1 Figure 2).