Skip directly to site content Skip directly to page options Skip directly to A-Z link Skip directly to A-Z link Skip directly to A-Z link
Volume 27, Number 1—January 2021
Research

Performance of Nucleic Acid Amplification Tests for Detection of Severe Acute Respiratory Syndrome Coronavirus 2 in Prospectively Pooled Specimens

Hannah Wang, Catherine A. Hogan, Jacob A. Miller, Malaya K. Sahoo, ChunHong Huang, Kenji O. Mfuh, Mamdouh Sibai, James Zehnder, Brendan Hickey, Nasa Sinnott-Armstrong, and Benjamin A. PinskyComments to Author 
Author affiliations: Stanford University School of Medicine, Stanford, California, USA (H. Wang, C.A. Hogan, J.A. Miller, M.K. Sahoo, C. Huang, J. Zehnder, N. Sinnott-Armstrong, B.A. Pinsky); Stanford Health Care, Stanford (K.O. Mfuh, M. Sibai, B.A. Pinsky); Stanford University, Stanford (N. Sinnott-Armstrong)

Main Article

Figure 3

Performance of nucleic acid amplification tests for detection of severe acute respiratory syndrome coronavirus 2 in prospectively pooled specimens. Model-estimated PPA and testing efficiency, by pool size, proportion of tests positive, and proportion of samples with Ct above the 95% LoD. For these estimates, LoD has been held constant at the experimentally-derived Ct of 35.9, although results are independent of specific LoD value. A) Expected PPA between pooled and individual testing at pool sizes of 1–20. PPA decreases with decreasing proportion of test results positive (indicated by colored lines in each plot), and with increasing proportion of samples with Ct values beyond the 95% LoD (each panel). At >5% test positivity, expected PPA starts to increase at larger pool sizes because there is a greater likelihood of 2 positive samples being in the same pool. The baseline PPA (pool size of 1) reflects the likelihood of obtaining the same individual result with repeat (nonpooled) testing. B) Estimated average tests per sample that would be performed at each pool size, with a lower number of average tests per sample corresponding to higher testing efficiency. Efficiency increases with decreasing proportion of test results positive, and slightly increases with increasing samples with Ct above the LoD. Each missed pool results in fewer deconvolutions, and thus fewer total tests performed. Ct, cycle threshold; LoD, limit of detection; PPA, positive percent agreement.

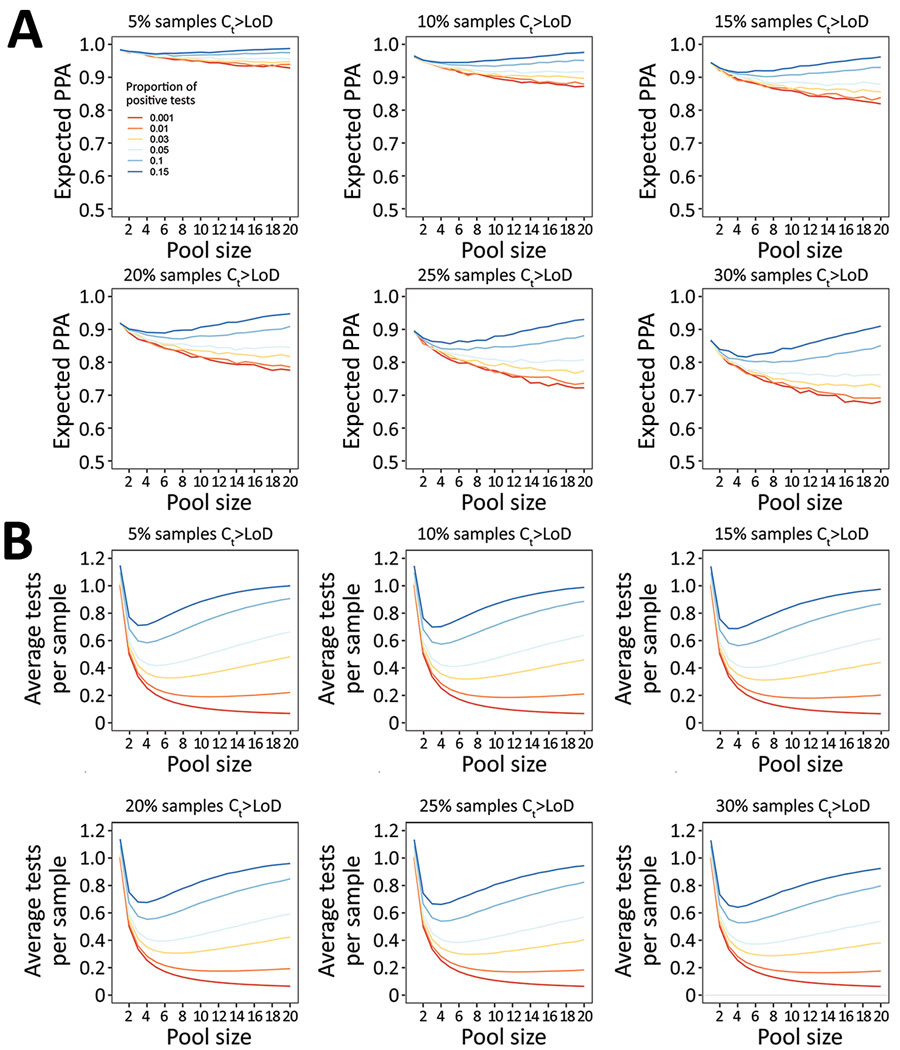
Figure 3. Performance of nucleic acid amplification tests for detection of severe acute respiratory syndrome coronavirus 2 in prospectively pooled specimens. Model-estimated PPA and testing efficiency, by pool size, proportion of tests positive, and proportion of samples with Ct above the 95% LoD. For these estimates, LoD has been held constant at the experimentally-derived Ct of 35.9, although results are independent of specific LoD value. A) Expected PPA between pooled and individual testing at pool sizes of 1–20. PPA decreases with decreasing proportion of test results positive (indicated by colored lines in each plot), and with increasing proportion of samples with Ct values beyond the 95% LoD (each panel). At >5% test positivity, expected PPA starts to increase at larger pool sizes because there is a greater likelihood of 2 positive samples being in the same pool. The baseline PPA (pool size of 1) reflects the likelihood of obtaining the same individual result with repeat (nonpooled) testing. B) Estimated average tests per sample that would be performed at each pool size, with a lower number of average tests per sample corresponding to higher testing efficiency. Efficiency increases with decreasing proportion of test results positive, and slightly increases with increasing samples with Ct above the LoD. Each missed pool results in fewer deconvolutions, and thus fewer total tests performed. Ct, cycle threshold; LoD, limit of detection; PPA, positive percent agreement.

Main Article

Page created: September 29, 2020
Page updated: December 21, 2020
Page reviewed: December 21, 2020
The conclusions, findings, and opinions expressed by authors contributing to this journal do not necessarily reflect the official position of the U.S. Department of Health and Human Services, the Public Health Service, the Centers for Disease Control and Prevention, or the authors' affiliated institutions. Use of trade names is for identification only and does not imply endorsement by any of the groups named above.
file_external