Skip directly to site content Skip directly to page options Skip directly to A-Z link Skip directly to A-Z link Skip directly to A-Z link
Volume 27, Number 1—January 2021
Research

Performance of Nucleic Acid Amplification Tests for Detection of Severe Acute Respiratory Syndrome Coronavirus 2 in Prospectively Pooled Specimens

Hannah Wang, Catherine A. Hogan, Jacob A. Miller, Malaya K. Sahoo, ChunHong Huang, Kenji O. Mfuh, Mamdouh Sibai, James Zehnder, Brendan Hickey, Nasa Sinnott-Armstrong, and Benjamin A. PinskyComments to Author 
Author affiliations: Stanford University School of Medicine, Stanford, California, USA (H. Wang, C.A. Hogan, J.A. Miller, M.K. Sahoo, C. Huang, J. Zehnder, N. Sinnott-Armstrong, B.A. Pinsky); Stanford Health Care, Stanford (K.O. Mfuh, M. Sibai, B.A. Pinsky); Stanford University, Stanford (N. Sinnott-Armstrong)

Main Article

Figure 5

Performance of nucleic acid amplification tests for detection of severe acute respiratory syndrome coronavirus 2 in prospectively pooled specimens. Empiric and modeled estimates of positive percent agreement (PPA) with 95% CIs for each pool size, testing platform, and sample type (all versus first initial diagnostic versus follow-up). Black circles indicate empiric PPA point estimates, and colored horizontal bars indicate 95% CI. The 95% CI for the in silico data are too narrow to be visible in this plot. Gray boxplots indicate the modeled estimate of PPA, vertical black lines indicate the modeled PPA point estimate, and gray box indicates the 95% CI of the probabilistic sensitivity analysis. No modeled estimates are available for Panther Aptima because this is a transcription-mediated amplification assay, and the model is based on dilutional effects inherent to real-time PCR only. The empiric 95% CIs contain the modeled PPA point estimates for all conditions except for pools of 8 follow-up tests only and the in silico data. Data used to generate this figure are provided in Appendix Table 3. Panther Fusion and Panther Aptima are from Hologic (https://www.hologic.com). LDT, laboratory-developed test; PSA, probabilistic sensitivity analysis.

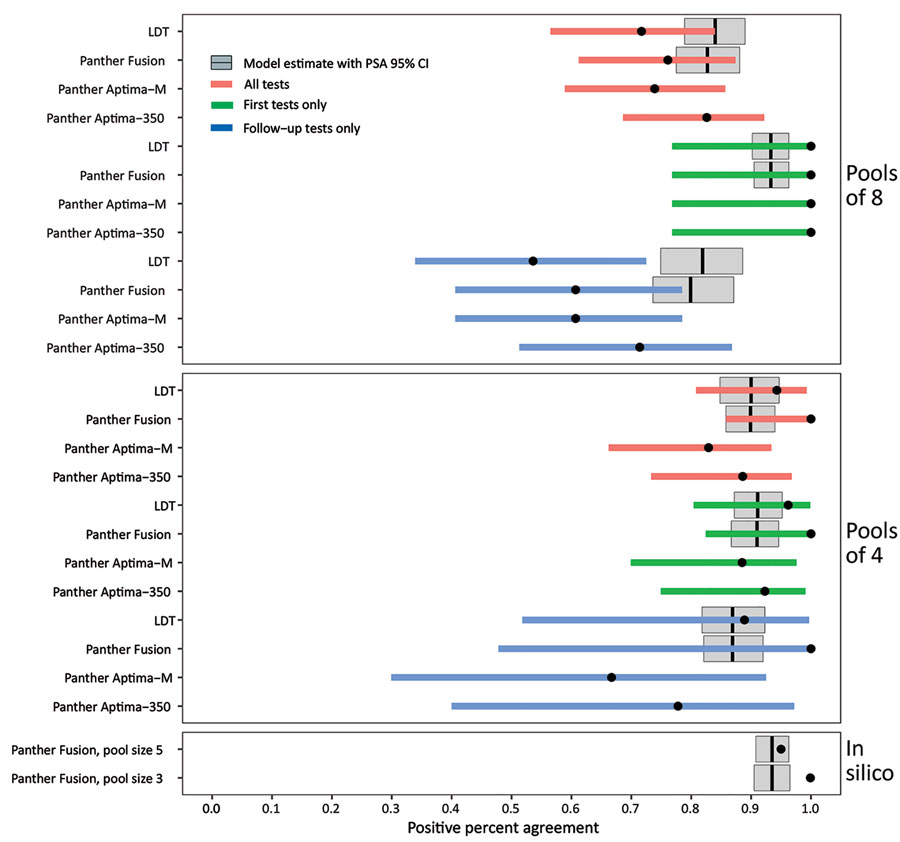
Figure 5. Performance of nucleic acid amplification tests for detection of severe acute respiratory syndrome coronavirus 2 in prospectively pooled specimens. Empiric and modeled estimates of positive percent agreement (PPA) with 95% CIs for each pool size, testing platform, and sample type (all versus first initial diagnostic versus follow-up). Black circles indicate empiric PPA point estimates, and colored horizontal bars indicate 95% CI. The 95% CI for the in silico data are too narrow to be visible in this plot. Gray boxplots indicate the modeled estimate of PPA, vertical black lines indicate the modeled PPA point estimate, and gray box indicates the 95% CI of the probabilistic sensitivity analysis. No modeled estimates are available for Panther Aptima because this is a transcription-mediated amplification assay, and the model is based on dilutional effects inherent to real-time PCR only. The empiric 95% CIs contain the modeled PPA point estimates for all conditions except for pools of 8 follow-up tests only and the in silico data. Data used to generate this figure are provided in Appendix Table 3. Panther Fusion and Panther Aptima are from Hologic (https://www.hologic.com). LDT, laboratory-developed test; PSA, probabilistic sensitivity analysis.

Main Article

Page created: September 29, 2020
Page updated: December 21, 2020
Page reviewed: December 21, 2020
The conclusions, findings, and opinions expressed by authors contributing to this journal do not necessarily reflect the official position of the U.S. Department of Health and Human Services, the Public Health Service, the Centers for Disease Control and Prevention, or the authors' affiliated institutions. Use of trade names is for identification only and does not imply endorsement by any of the groups named above.
file_external