Skip directly to site content Skip directly to page options Skip directly to A-Z link Skip directly to A-Z link Skip directly to A-Z link
Volume 27, Number 1—January 2021
Research

Performance of Nucleic Acid Amplification Tests for Detection of Severe Acute Respiratory Syndrome Coronavirus 2 in Prospectively Pooled Specimens

Hannah Wang, Catherine A. Hogan, Jacob A. Miller, Malaya K. Sahoo, ChunHong Huang, Kenji O. Mfuh, Mamdouh Sibai, James Zehnder, Brendan Hickey, Nasa Sinnott-Armstrong, and Benjamin A. PinskyComments to Author 
Author affiliations: Stanford University School of Medicine, Stanford, California, USA (H. Wang, C.A. Hogan, J.A. Miller, M.K. Sahoo, C. Huang, J. Zehnder, N. Sinnott-Armstrong, B.A. Pinsky); Stanford Health Care, Stanford (K.O. Mfuh, M. Sibai, B.A. Pinsky); Stanford University, Stanford (N. Sinnott-Armstrong)

Main Article

Figure 4

Performance of nucleic acid amplification tests for detection of severe acute respiratory syndrome coronavirus 2 in prospectively pooled specimens. Model-estimated PPA and testing efficiency, by pool size, proportion of tests positive, and assay analytical sensitivity as approximated by the Ct corresponding to the 95% LoD. For these estimates, the population viral load distribution has been held constant at 15% of samples with Ct values >35. A) Expected PPA between pooled and individual testing at pool sizes of 1–20. PPA decreases with decreasing proportion of tests positive (indicated by colored lines in each plot) and increases with increased analytical sensitivity (each panel). This result occurs because the proportion of individual samples with a Ct value above each LoD decreases as the Ct LoD increases. B) Estimated average tests per sample that would be performed at each pool size, with a lower number of average tests per sample corresponding to higher testing efficiency. Efficiency increases with decreasing proportion of test results positive, and slightly decreases with increased analytical sensitivity because more pools detected results in an increased number of individual tests performed at the deconvolution step. Ct, cycle threshold; LoD, limit of detection; PPA, positive percent agreement.

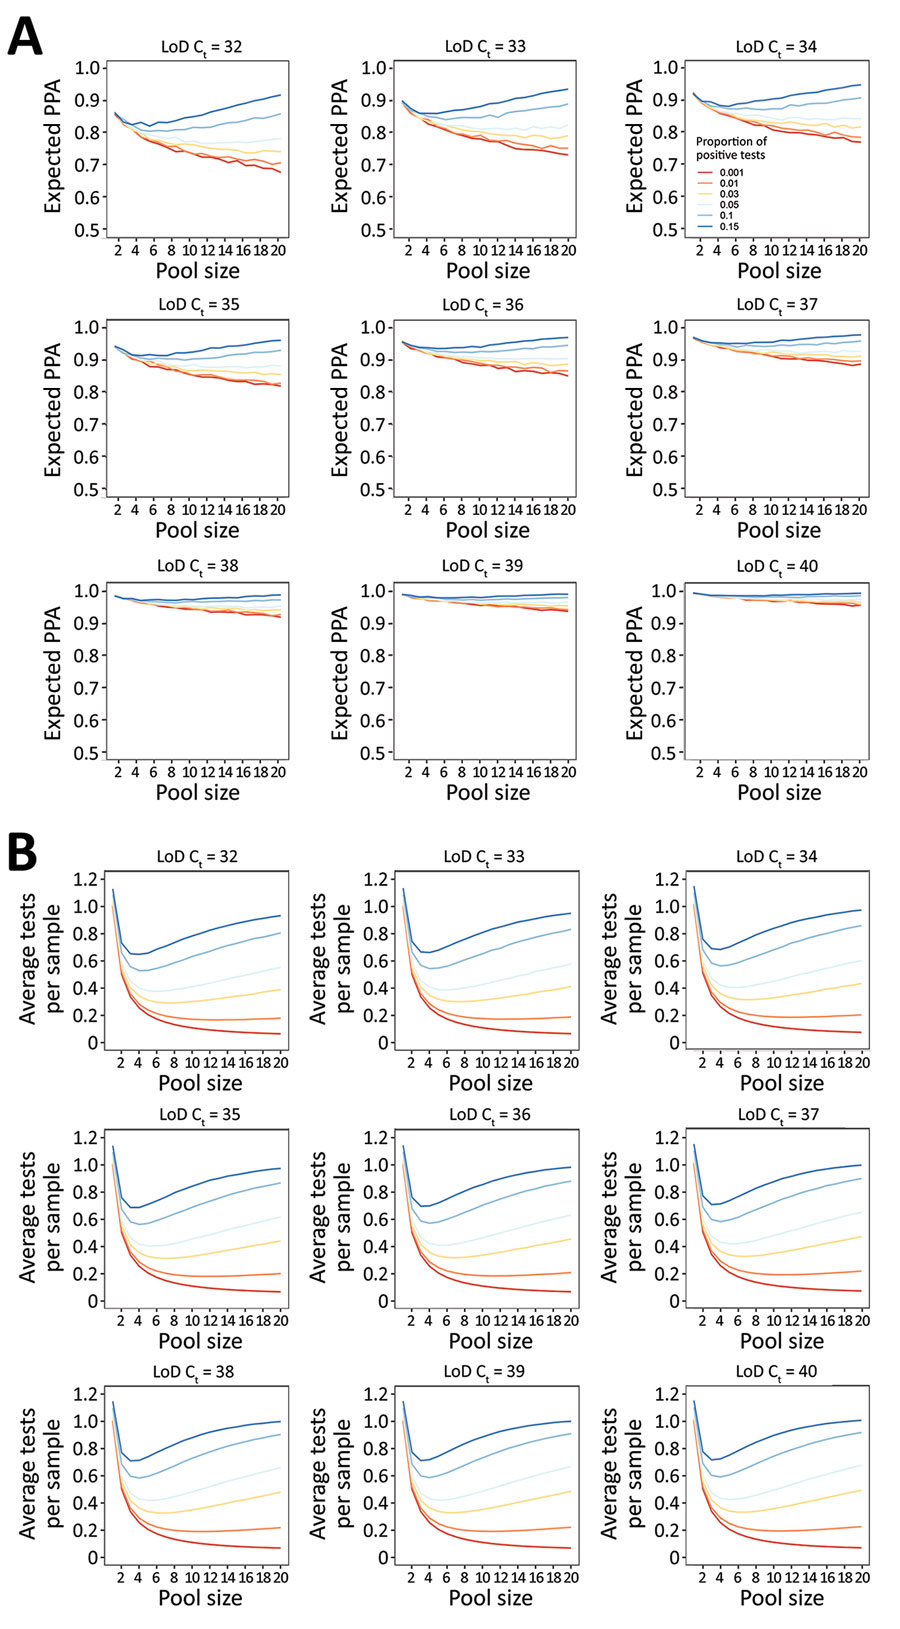
Figure 4. Performance of nucleic acid amplification tests for detection of severe acute respiratory syndrome coronavirus 2 in prospectively pooled specimens. Model-estimated PPA and testing efficiency, by pool size, proportion of tests positive, and assay analytical sensitivity as approximated by the Ct corresponding to the 95% LoD. For these estimates, the population viral load distribution has been held constant at 15% of samples with Ct values >35. A) Expected PPA between pooled and individual testing at pool sizes of 1–20. PPA decreases with decreasing proportion of tests positive (indicated by colored lines in each plot) and increases with increased analytical sensitivity (each panel). This result occurs because the proportion of individual samples with a Ct value above each LoD decreases as the Ct LoD increases. B) Estimated average tests per sample that would be performed at each pool size, with a lower number of average tests per sample corresponding to higher testing efficiency. Efficiency increases with decreasing proportion of test results positive, and slightly decreases with increased analytical sensitivity because more pools detected results in an increased number of individual tests performed at the deconvolution step. Ct, cycle threshold; LoD, limit of detection; PPA, positive percent agreement.

Main Article

Page created: September 29, 2020
Page updated: December 21, 2020
Page reviewed: December 21, 2020
The conclusions, findings, and opinions expressed by authors contributing to this journal do not necessarily reflect the official position of the U.S. Department of Health and Human Services, the Public Health Service, the Centers for Disease Control and Prevention, or the authors' affiliated institutions. Use of trade names is for identification only and does not imply endorsement by any of the groups named above.
file_external