Volume 27, Number 11—November 2021
Dispatch
Correlation of SARS-CoV-2 Subgenomic RNA with Antigen Detection in Nasal Midturbinate Swab Specimens
Cite This Article
Citation for Media
Abstract
Among symptomatic outpatients, subgenomic RNA of severe acute respiratory syndrome coronavirus 2 in nasal midturbinate swab specimens was concordant with antigen detection but remained detectable in 13 (82.1%) of 16 nasopharyngeal swab specimens from antigen-negative persons. Subgenomic RNA in midturbinate swab specimens might be useful for routine diagnostics to identify active virus replication.
Accurate detection of severe acute respiratory syndrome coronavirus 2 (SARS-CoV-2) infection is critical for patient management and infection control (1). Molecular diagnostics are highly sensitive in the acute phase of coronavirus diseases (COVID-19), but viral RNA remains detectable long after replicating virus can be isolated from respiratory samples (1–5). Antigen diagnostics, though often less sensitive, are touted as providing accurate detection during peak infectivity, thereby identifying persons most likely to transmit SARS-CoV-2 (6,7).
Prolonged SARS-CoV-2 RNA detection has led to evaluation of molecular assays to detect subgenomic RNA (sgRNA) or negative-strand RNA, which are produced during active viral replication (2–5,8–10). sgRNA detection has predominantly been studied in hospitalized adults who have COVID-19 (2,3,5,8,9); published reports have not compared sgRNA and antigen detection, which should be highly correlated. We compared real-time reverse transcription PCR (rRT-PCR) detection of nucleocapsid sgRNA, the most abundant sgRNA in SARS-CoV-2‒infected cells (2), with nucleocapsid antigen detection among symptomatic outpatients who had SARS-CoV-2 infections.
We obtained 88 nasal midturbinate and 39 nasopharyngeal swab specimens (PurFlock Ultra Flocked Swabs; Puritan Medical Products, https://www.puritanmedproducts.com) from 127 persons who came to COVID-19 testing centers affiliated with Emory University and Children’s Healthcare of Atlanta (Atlanta, GA, USA) during January 2021. Inclusion criteria were a symptomatic respiratory illness for <7 days and a positive, routine-care SARS-CoV-2 molecular test (nasopharyngeal swab specimen). The study was approved by the Emory University Institutional Review Board and Children’s Healthcare of Atlanta.
We extracted total nucleic acids from 500 μL of sample and eluted them into a volume of 50 μL by using an EMAG Instrument (bioMérieux, https://www.biomerieux.com). We tested eluates side-by-side in rRT-PCRs for sgRNA and total SARS-CoV-2 RNA (genomic plus sgRNA). For sgRNA, we combined a forward primer in the leader sequence (5′-CGATCTCTTGTAGATCTGTTCTC-3′) with the nucleocapsid 2 (N2) target reverse primer and probe (11).
We performed the sgRNA assay in 20-μL reactions using the Luna Probe One-Step RT-qPCR Kit (New England Biolabs, https://www.neb.com) with 500 nmol/L of each primer, 250 nmol/L of probe, and 5 μL of eluate by using the following conditions: 55°C for 15 min, 95°C for 2 min, and 45 cycles of 95°C for 15 s and 60°C for 60 s. We detected total SARS-CoV-2 RNA by using a duplex N2-RNase P rRT-PCR performed as described (12). We obtained an anterior nares swab specimen for nucleocapsid antigen detection with the Abbott BinaxNOW COVID-19 Ag Card (swabs supplied with the BinaxNOW kit; Abbott Laboratories, https://www.abbott.com) performed per the package insert.
The first 73 participants had a midturbinate swab specimen available for molecular testing (evaluation group) and have been described (13). The subsequent 54 participants had dedicated midturbinate (n = 15) or residual nasopharyngeal (n = 39) swab specimens for molecular testing and available antigen test results (antigen testing group) (Appendix Figure 1).
We estimated nucleocapsid sgRNA as a percentage of total RNA by calculating copies per microliter of sgRNA and total RNA for each sample based on a standard curve for each target and then calculating the percentage of sgRNA. We used unpaired t-tests to compare continuous variables and the Fisher exact test for testing categorical variables. We performed simple linear regression to compare cycle threshold (Ct ) values for sgRNA and total RNA. We conducted analyses by using GraphPad version 9.02 (https://www.graphpad.com) and SAS version 9.4 (https://support.sas.com).
Figure 1
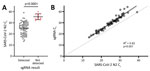
Figure 1. Correlation of sgRNA levels with total SARS-CoV-2 RNA in samples from study participants in Atlanta, Georgia, USA. A) N2 Ctvalues for samples in which sgRNA was detectable (gray...
The evaluation group included midturbinate swab specimens from 36 adults and 37 children. All samples (73/73) were positive for SARS-CoV-2 by rRT-PCR. Samples with detectable sgRNA (62/73, 84.9%) had significantly lower Ct values, indicative of higher viral loads, than samples without detectable sgRNA (mean Ct 25.1, SD 5.5, vs. mean Ct 35.5, SD 2.6; p<0.0001) (Figure 1, panel A). sgRNA was detectable in all samples (49/49) that had N2 Ct values <30 compared with 13 (54.2%) of 24 samples that had Ct values >30 (p<0.0001). Although sgRNA rRT-PCR amplification efficiency was slightly lower than that for the N2 assay, there was a strong linear correlation between sgRNA and N2 Ct values (Figure 1, panel B), and the assay provided linear sgRNA detection across the range of N2 Ct values observed in this study (Appendix Figure 2). sgRNA Ct values were a mean of 4.8 (SD 1.8) cycles higher than corresponding N2 Ct values, and nucleocapsid gene sgRNA accounted for a mean of 1.4% (SD 1.1%) of SARS-CoV-2 RNA. Samples from children had higher viral loads than samples from adults, although the relative amount of sgRNA did not differ (Appendix Figure 3).
Figure 2
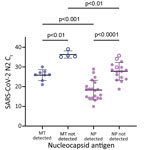
Figure 2. Concordance of SARS-CoV-2 sgRNA with nucleocapsid antigen detection in MT swab specimens, but not NP swab specimens, from study participants in Atlanta, Georgia, USA. sgRNA remains detectable in NP swab...
We complied characteristics of participants in the antigen-testing group who had midturbinate (n = 15) swab specimens (Table 1) and nasopharyngeal (n = 39) swab specimens (Table 2). All midturbinate swab specimens from participants who had detectable antigen (n = 8) were also positive for sgRNA, whereas 0/4 samples from antigen-negative persons were positive (κ 1.0). Samples that had detectable sgRNA had significantly lower Ct values (mean 25.8, SD 2.7) than samples that did not have detectable sgRNA (mean 36.3, SD 1.8; p = 0.002) (Figure 2).
All (20/20) nasopharyngeal swab specimens from antigen-positive participants were positive for sgRNA. N2 Ct values were significantly lower among antigen-positive participants (mean 18.2, SD 5.0) than antigen-negative participants (mean 27.8, SD 4.5; p<0.0001) (Figure 2). sgRNA was detectable in 13 (81.2%) of 16 nasopharyngeal swab specimens from antigen-negative persons. Days after symptom onset (when the sample was collected) did not differ significantly between antigen-positive and sgRNA-positive/antigen-negative participants (mean 3.4, SD 1.9 days, vs. mean 3.8, SD 2.4 days; p = 0.6). Nucleocapsid gene sgRNA accounted for a smaller percentage of total SARS-CoV-2 RNA in antigen-negative participants (mean 0.6%, SD 0.4%) vs. antigen-positive participants (mean 1.0%, SD 0.5%; p = 0.012) (Appendix Figure 4). Compared with midturbinate swab specimens, nasopharyngeal swab specimens had lower Ct values for RNase P (Appendix Figure 5).
SARS-CoV-2 sgRNA was detected in all samples from antigen-positive participants (28/28 total), consistent with identification of active viral replication and potential shedding (4,5,8). However, among antigen-negative participants, sgRNA detection varied between SARS-CoV-2 RNA-positive midturbinate (0/4) and nasopharyngeal (13/16) swab specimens. Although nasopharyngeal swab specimens are expected to have higher viral loads (14), this difference did not appear to be the sole explanation. sgRNA represented a smaller proportion of total SARS-CoV-2 RNA in discordant nasopharyngeal swab specimens, and overall, nasopharyngeal swab specimens had higher amounts of human cellular material (lower RNase P Ct values) than midturbinate swab specimens. Therefore, discordant sgRNA and antigen results in nasopharyngeal swab specimens probably resulted from persistent detection of waning SARS-CoV-2 infections with low levels of detectable sgRNA, which is only found in infected cells but insufficient viral replication to yield detectable nucleocapsid antigen in the anterior nares.
Nucleocapsid antigen was detected by using the widely available BinaxNOW COVID-19 Ag Card. This card demonstrates similar performance to other rapid antigen tests, which commonly detect nucleocapsid protein, and maintains analytical sensitivity against SARS-CoV-2 variants (7). Therefore, it provided a useful and relevant comparator for sgRNA detection.
Limitations of our study include a relatively small number of midturbinate swab specimens tested in the antigen-testing group, which was affected by the need for multiple swab specimens at a single time point. The race/ethnicity makeup of groups that had midturbinate and nasopharyngeal swab specimens differed (Tables 1, 2), although this limitation is not expected to have affected our findings (15).
In conclusion, sgRNA detection in midturbinate swab specimens correlates with nucleocapsid antigen and could be implemented as a molecular test to evaluate infectivity. Given the strong correlation between sgRNA, nucleocapsid antigen, and total SARS-CoV-2 RNA, these data also support use of antigen testing or establishment of rRT-PCR Ct values as markers of active replication.
At the time of this study, Ms. Immergluck was a research specialist in the Division of Infectious Diseases, Emory University School of Medicine, Atlanta, GA. She is currently completing her final year at Pomona College, Claremont, CA. Her research interest is development of new molecular methods for the detection of RNA viruses.
Acknowledgments
We thank the staff of the Atlanta Center for Microsystems Engineered Point-of-Care Technologies for their contributions and efforts, and study participants and family members for providing samples and clinical information.
This study was supported by the National Institutes of Health/National Institute of Biomedical Imaging and Bioengineering (grants U54 EB027690 02S1 and UL1 TR002378).
References
- Centers for Disease Control and Prevention. Healthcare workers: information on COVID-19. 2021, March 31, 2021 [cited 2021] Apr 21 https://www.cdc.gov/coronavirus/2019-ncov/hcp
- Dimcheff DE, Valesano AL, Rumfelt KE, Fitzsimmons WJ, Blair C, Mirabelli C, et al. SARS-CoV-2 total and subgenomic RNA viral load in hospitalized patients. J Infect Dis. 2021;•••:
jiab215 ; Epub ahead of print. DOIPubMedGoogle Scholar - Hogan CA, Huang C, Sahoo MK, Wang H, Jiang B, Sibai M, et al. Strand-specific reverse transcription PCR for detection of replicating SARS-CoV-2. Emerg Infect Dis. 2021;27:632–5. DOIPubMedGoogle Scholar
- Perera RAPM, Tso E, Tsang OTY, Tsang DNC, Fung K, Leung YWY, et al. SARS-CoV-2 virus culture and subgenomic RNA for respiratory specimens from patients with mild coronavirus disease. Emerg Infect Dis. 2020;26:2701–4. DOIPubMedGoogle Scholar
- van Kampen JJA, van de Vijver DAMC, Fraaij PLA, Haagmans BL, Lamers MM, Okba N, et al. Duration and key determinants of infectious virus shedding in hospitalized patients with coronavirus disease-2019 (COVID-19). Nat Commun. 2021;12:267. DOIPubMedGoogle Scholar
- Mina MJ, Parker R, Larremore DB. Rethinking COVID-19 test sensitivity: a strategy for containment. N Engl J Med. 2020;383:
e120 . DOIPubMedGoogle Scholar - Frediani JK, Levy JM, Rao A, Bassit L, Figueroa J, Vos MB, et al. Multidisciplinary assessment of the Abbott BinaxNOW SARS-CoV-2 point-of-care antigen test in the context of emerging viral variants and self-administration. Sci Rep. 2021;11:14604. DOIPubMedGoogle Scholar
- Rodríguez-Grande C, Adán-Jiménez J, Catalán P, Alcalá L, Estévez A, Muñoz P, et al. Inference of active viral replication in cases with sustained positive reverse transcription-PCR results for SARS-CoV-2. J Clin Microbiol. 2021;59:e02277–20. DOIPubMedGoogle Scholar
- Wölfel R, Corman VM, Guggemos W, Seilmaier M, Zange S, Müller MA, et al. Virological assessment of hospitalized patients with COVID-2019. Nature. 2020;581:465–9. DOIPubMedGoogle Scholar
- Dagotto G, Mercado NB, Martinez DR, Hou YJ, Nkolola JP, Carnahan RH, et al. Comparison of subgenomic and total RNA in SARS-CoV-2 challenged rhesus macaques. J Virol. 2021;
JVI.02370-20 ; [Epub ahead of print].PubMedGoogle Scholar - Centers for Disease Control and Prevention. Real-time RT-PCR panel for detection 2019-novel coronavirus, instructions for use, 2020 [cited 2021 Aug 17]. https://www.cdc.gov//coronavirus/2019-ncov/lab/rt-pcr-panel-primer-probes.html
- Waggoner JJ, Stittleburg V, Pond R, Saklawi Y, Sahoo MK, Babiker A, et al. Triplex real-time RT-PCR for severe acute respiratory syndrome coronavirus 2. Emerg Infect Dis. 2020;26:1633–5. DOIPubMedGoogle Scholar
- Levy JM, Frediani JK, Tyburski EA, Wood A, Figueroa J, Kempker RR, et al. Impact of repeated nasal sampling on detection and quantification of SARS-CoV-2. Sci Rep. 2021;11:14903. DOIPubMedGoogle Scholar
- Pinninti S, Trieu C, Pati SK, Latting M, Cooper J, Seleme MC, et al. Comparing nasopharyngeal and midturbinate nasal swab testing for the identification of severe acute respiratory syndrome coronavirus 2. Clin Infect Dis. 2021;72:1253–5. DOIPubMedGoogle Scholar
- Kociolek LK, Muller WJ, Yee R, Dien Bard J, Brown CA, Revell PA, et al. Comparison of upper respiratory viral load distributions in asymptomatic and symptomatic children diagnosed with SARS-CoV-2 infection in pediatric hospital testing programs. J Clin Microbiol. 2020;59:e02593–20. DOIPubMedGoogle Scholar
Figures
Tables
Cite This ArticleOriginal Publication Date: August 23, 2021
1Current affiliation: Pomona College, Claremont, California, USA.
Table of Contents – Volume 27, Number 11—November 2021
| EID Search Options |
|---|
|
|
|
|
|
|
Please use the form below to submit correspondence to the authors or contact them at the following address:
Jesse J. Waggoner, Division of Infectious Diseases, Emory University School of Medicine, 1760 Haygood Dr NE, Rm E-169, Atlanta, GA 30322, USA
Top