Volume 30, Number 8—August 2024
Dispatch
Spatiotemporal Modeling of Cholera, Uvira, Democratic Republic of the Congo, 2016−2020
Ruwan Ratnayake , Jackie Knee, Oliver Cumming, Jaime Mufitini Saidi, Baron Bashige Rumedeka, Flavio Finger, Andrew S. Azman, W. John Edmunds, Francesco Checchi1, and Karin Gallandat1
Figure 1
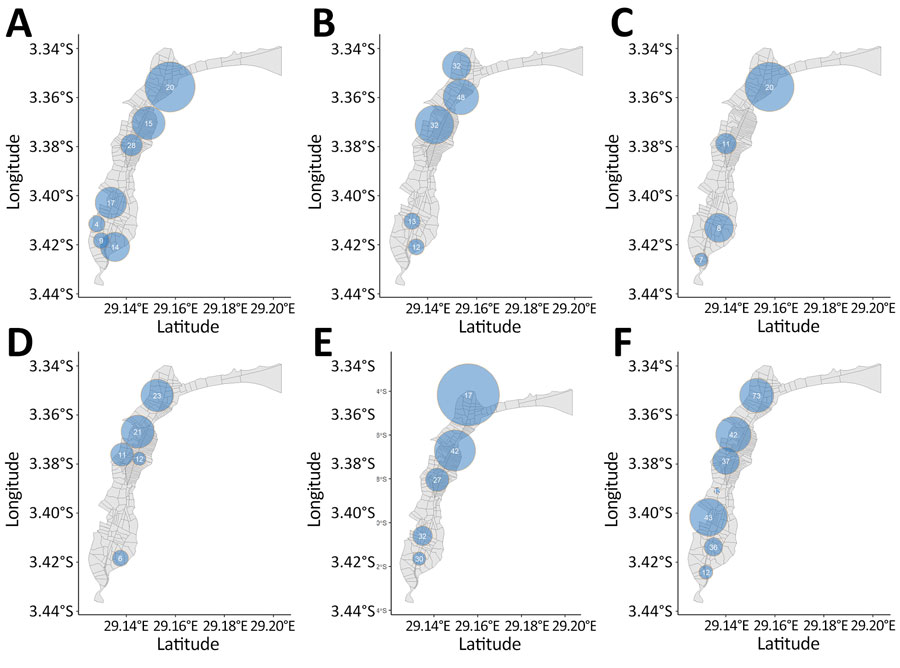
Figure 1. Spatial distribution of spatiotemporal clusters of rapid diagnostic test–positive cholera cases at the avenue level, Uvira, Democratic Republic of the Congo, 2016−2020. A: 2016, B: 2017, C: 2018, D: 2019, E: 2020, F: 2016—2020. Clusters have a relative risk >1 (p<0.05). The sizes of the light blue circles depict the spatial radius and the numbers of cases are shown inside the circles.
1These senior authors contributed equally to this article.
Page created: June 25, 2024
Page updated: July 22, 2024
Page reviewed: July 22, 2024
The conclusions, findings, and opinions expressed by authors contributing to this journal do not necessarily reflect the official position of the U.S. Department of Health and Human Services, the Public Health Service, the Centers for Disease Control and Prevention, or the authors' affiliated institutions. Use of trade names is for identification only and does not imply endorsement by any of the groups named above.