Spatiotemporal Modeling of Cholera, Uvira, Democratic Republic of the Congo, 2016−2020
Ruwan Ratnayake

, Jackie Knee, Oliver Cumming, Jaime Mufitini Saidi, Baron Bashige Rumedeka, Flavio Finger, Andrew S. Azman, W. John Edmunds, Francesco Checchi
1, and Karin Gallandat
1
Author affiliations: London School of Hygiene & Tropical Medicine, London, UK (R. Ratnayake, J. Knee, O. Cumming, W.J. Edmunds, F. Checchi, K. Gallandat); Ministère de la Santé Publique, Division Provinciale de la Santé du Sud-Kivu, Zone de Santé d’Uvira, Uvira, Democratic Republic of the Congo (J.M. Saidi, B.B. Rumedeka); Epicentre, Paris, France (F. Finger); Johns Hopkins Bloomberg School of Public Health, Baltimore, Maryland, USA (A.S. Azman); Geneva University Hospitals, Geneva, Switzerland (A.S. Azman)
Main Article
Figure 3
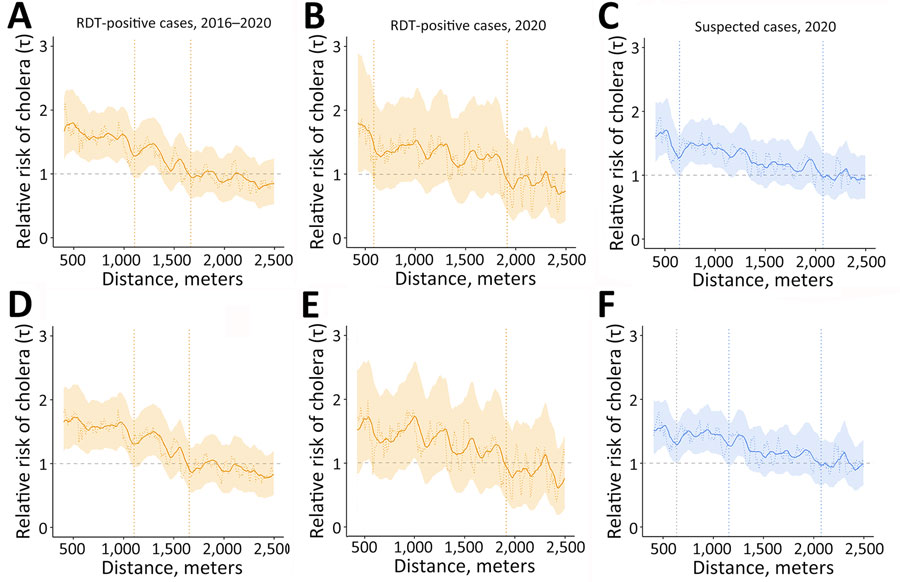
Figure 3. Moving average estimates for RDT-positive and suspected cholera cases in study of spatiotemporal modeling of cholera, Uvira, Democratic Republic of the Congo, 2016−2020. Moving average estimates of (relative risk) and 95% CIs (shading) are shown with point estimates (dashed horizontal lines) for days 0–4 (panels A–C) and days 1–4 (panels D–F), for RDT-positive cases (orange) and suspected cases (blue), using 1,000 bootstrap samples. The vertical dashed lines indicate the spatial extent of the zone of high-risk where the lower 95% CI crossed 1.0 for ≥30 meters consecutively (first line) and zone of elevated risk where the point estimate crossed 1.0 for ≥30 meters consecutively (second line). RDT, rapid diagnostic test.
Main Article
Page created: June 25, 2024
Page updated: July 22, 2024
Page reviewed: July 22, 2024
The conclusions, findings, and opinions expressed by authors contributing to this journal do not necessarily reflect the official position of the U.S. Department of Health and Human Services, the Public Health Service, the Centers for Disease Control and Prevention, or the authors' affiliated institutions. Use of trade names is for identification only and does not imply endorsement by any of the groups named above.