Volume 30, Number 8—August 2024
Dispatch
Spatiotemporal Modeling of Cholera, Uvira, Democratic Republic of the Congo, 2016−2020
Cite This Article
Citation for Media
Abstract
We evaluated the spatiotemporal clustering of rapid diagnostic test−positive cholera cases in Uvira, eastern Democratic Republic of the Congo. We detected spatiotemporal clusters that consistently overlapped with major rivers, and we outlined the extent of zones of increased risk that are compatible with the radii currently used for targeted interventions.
Cholera outbreaks affect communities that lack access to safe water and adequate sanitation (1). Spatiotemporal clustering patterns of cholera indicate a high risk of transmission to the neighboring households of new cases (2,3). Case-area targeted interventions (CATI), consisting of early, multisectoral response within a 100–500-meter radius around case-households, have been proposed to attenuate clustered transmission (4). CATIs, driven by water, sanitation, and hygiene interventions, played a major role in response strategies in Haiti and Yemen, and CATIs including oral cholera vaccination helped suppress outbreaks after vaccination campaigns in Cameroon (5,6). In the Democratic Republic of the Congo (DRC), health officials evaluated water, sanitation, and hygiene targeting strategies within 500 meters around households with cholera cases (7). In Kalemie, DRC, and N’Djamena, Chad, researchers estimated a 200-meter zone of increased risk of infection around cholera cases in the first 5 days (2). As CATIs become part of routine practice (4,5), more insight is needed in delineating the spatiotemporal risk zones required to achieve a substantive effect on transmission.
In Uvira, a city in eastern DRC affected by protracted conflict, population displacement, and flooding, cholera is endemic, and stable transmission is punctuated by seasonal outbreaks (8). Citywide interventions include an ongoing piped water supply program with household tap installation beginning in late 2019 (9) and mass vaccination in mid-2020 (10). Using an enhanced surveillance system with rapid diagnostic testing (RDT), we investigated the location, timing, and prediction of clusters to identify outbreaks earlier and trigger early response. We estimated the extent of spatiotemporal zones of increased risk around cases as a proxy for the ideal radius of CATIs.
We analyzed suspected cases of cholera during 2016–2020 in patients at cholera treatment centers managed by the Uvira Health Zone. Beginning in April 2016, rectal swab samples were collected from suspected cases and RDT tested (Crystal VC O1/O139; Arkray Inc., https://www.arkray.co.in) after a 6-hour enrichment in alkaline peptone water. We classified cases by avenue of residence (i.e., enumeration areas of mean size 1,177 [range 180–5,711] based on 2017 population sizes) (town of Uvira census data, 2018, unpub. data). We used 2 methods to evaluate spatiotemporal clustering. The space–time scan statistic describes local clustering, where cases exceed expected density within a given area, to identify spatiotemporal clusters and assign relative risk comparing observed versus expected cases inside and outside the cluster (11). To assess capacity for early detection of outbreaks, we simulated real-time detection by scanning prospectively (using few cases) and compared the delay with retrospective scanning (using more cases). We calculated the proportion of years that avenues were included in clusters during 2016–2020. The tau statistic () describes global clustering, or the overall tendency for cases to occur near other cases in time and space (12), by using a relative risk of an individual in the population within a given distance band (i.e., 100–150 meters) from an incident case, compared with the risk for any individual in the population, becoming a potentially transmission-related case. This statistic suggests the geographic and temporal extents of increased infection risk. We defined the high-risk and elevated-risk zones as the radius where the moving average’s lower 95% CI (high risk) and point estimate (elevated risk) cross 1.0 for ≥30 consecutive meters. We based the main analyses on enriched RDT-positive cases. We conducted sensitivity analyses using suspected cases, and given the use of enumeration areas, using simulated household locations (Appendix). We carried out analyses in R software v.4.1.2 (The R Foundation for Statistical Computing, https://www.r-project.org) by using the rsatscan v.1.0.5 (combined with SaTScan v.10.0.2) and IDSpatialStats v.0.3.12 packages.
Figure 1
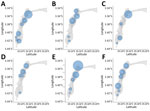
Figure 1. Spatial distribution of spatiotemporal clusters of rapid diagnostic test–positive cholera cases at the avenue level, Uvira, Democratic Republic of the Congo, 2016−2020. A: 2016, B: 2017, C: 2018, D: 2019,...
Figure 2
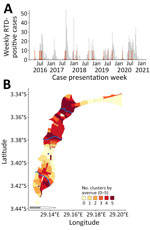
Figure 2. Epidemic curve and cluster persistence in study of spatiotemporal modeling of cholera, Uvira, Democratic Republic of the Congo, 2016−2020. A) Epidemic curve shows weekly numbers of RDT-positive cholera cases based...
Among 5,447 suspected cases, 3,456 (63.4%) were tested and 1,493 (43.2%) were RDT positive. We detected 26 significant spatiotemporal clusters (Table). Mean cluster radius was 652 (range 308–1582) meters, mean size was 20 (range 4–48) cases, and mean duration was 24.8 (range 1–58) days. Clustering occurred in similar locations annually (Figure 1). The first day of a retrospectively detected cluster usually anticipated a seasonal outbreak within 1 week, except for 2016 and 2017, when few cases were RDT tested (Figure 2, panel A). The median delay to the early outbreak signal was 1 day (interquartile range 0–3, maximum 23 days), and median size at signal detection was 3 cases (interquartile range 2–7, maximum 21 cases). Large clusters persisted across 2016–2020 and overlapped with major rivers in north-central and southern Uvira (Figure 2, panel B). We observed no changes in cluster locations in 2019, after household tap implementation began (Figures 1, panels D, E). Sensitivity analysis of suspected cases found more clusters (n = 32) in similar locations with similar mean radii (668 [range 331–1,557] meters), larger mean size (42 [range 6–130] cases), and longer duration (27.8 [range 1–59] days) (Appendix Table 2, Figure 5).
Figure 3
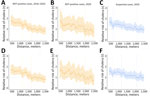
Figure 3. Moving average estimates for RDT-positive and suspected cholera cases in study of spatiotemporal modeling of cholera, Uvira, Democratic Republic of the Congo, 2016−2020. Moving average estimates of (relative risk) and...
In 2016–2020, within 5 days after cases began, the high-risk zone extended to 1,105 meters, and risk remained elevated up to 1,665 meters (maximum moving average τ = 1.8, 95% CI 1.4–2.3) (Figure 3, panel A). During days 1–4, which is more realistic for response, risk zones remained similar (Figure 3, panel D). In 2020, the high-risk zone extended to 585 meters and risk remained elevated up to 1,915 meters (τ = 1.8, 95% CI 1.0–2.9) (Figure 3, panel B). During days 1–4, the risk zones were 425 meters (high risk) and 1,915 meters (τ = 1.7, 95% CI 1.1–2.6) (Figure 3, panel E). Results were similar when we used simulated household locations (during days 0–4) with a moving average τ≥2.0 at 75–275 meters (τ = 2.4, 95% CI 1.7–3.3) and high-risk zone radius (1,415 meters) (Appendix Table 1, Figure 4). Annual results showed lower high-risk (425 meters, except 2017, when it was 875 meters) and elevated (1,125–1,485 meters) zone ranges and no discernable changes after 2019, when household tap implementation began (Appendix Figure 6). Using suspected cases from 2020, the trends remained similar (Figure 3, panels E, F).
We detected spatiotemporal clustering of cholera outbreaks during 2016–2020 in Uvira, DRC, that could inform early mitigation of seasonal outbreaks. The clustering methods produced aligned results compatible with a high-risk radius of ≤500 meters, as previously used for CATI in DRC (7,13) and similar to clustering in Matlab, Bangladesh, and coastal Sabah, Malaysia (500 meters, ≈5 days after cases began) (3,14). For RDT-positive cases within 5 days after cases began, we estimated a 1,105-meter high-risk radius, showing that a ≤1,000-meter risk window is optimal. Scan statistics detected a similar mean cluster radius of 650 meters. The simulated real-time scanning usually signaled an outbreak with a 1-day median delay, which would enable early control.
We used enriched RDT-positive cases to increase specificity, but among study limitations is that we relied on medically attended cases at a cholera treatment center, biasing toward severely dehydrated case-patients and against milder cases. The spatial resolution misses case-pair distances <420 meters, where 5% of distances fell, although simulation of household locations showed similar trends with even higher across smaller radii. Circular scan statistics have reduced sensitivity to outline the shape of elliptical clusters (potentially along Uvira’s coastline), but detection appeared unaffected (11).
Conspicuously, the clusters endured annually and overlapped with Uvira’s 3 major rivers. According to surveys in 2016, 2017, and 2021, households in those clusters commonly use rivers as a primary water source (K. Gallandat et al., unpub. data) because piped water has remained inconsistent (15). Combined with the high population density and inadequate sanitation, close-contact, fecal–oral transmission is amplified, producing recurrent clustering. Preventive measures, including piped water and vaccination, could be reinforced in cluster locations. CATI could address containment for new cases in less affected areas to prevent larger outbreaks. Because lakeside cities like Uvira may regularly seed regional outbreaks, targeted disease control strategies may bring substantial public health benefits.
Dr. Ratnayake is an infectious disease epidemiologist with a background in public health in humanitarian crises. This analysis was part of his PhD at the London School of Hygiene and Tropical Medicine on the spatial modelling and field evaluation of case-area targeted interventions for cholera outbreaks. His research links field epidemiology and mathematical modelling to improve public health responses for vulnerable and crisis-affected populations.
Acknowledgments
We thank the Uvira Health Zone and cholera treatment center/unit (CTC/CTU) collaborators for the support provided to testing and data collection, often under difficult circumstances. We thank John Giles for advice on implementing the IDSpatialStats package. Last, we thank the patients who participated in the main study.
All data and code produced are available online at https://github.com/ruwanepi/Uvira_spatiotemporal.
R.R. is funded by a Doctoral Foreign Study Award from the Canadian Institutes of Health Research (award no. DFS-164266). The trial on which this study sources its data was co-funded by the French Agency for Development (ref. no. EVA/364-2015) and the Veolia Foundation (ref. no. 13/14 HD 1123).
Ethics approval was provided by the London School of Hygiene and Tropical Medicine (#10603-5) and the University of Kinshasa School of Public Health (#ESP/CE/173B/2022) as an amendment to the primary study for which the cholera case data was collected (9).
References
- World Health Organization. Multi-country outbreak of cholera: external situation report #11. Geneva, Switzerland; February 12, 2024. [cited 2024 July 2] https://www.who.int/publications/m/item/multi-country-outbreak-of-cholera--external-situation-report--11---12-february-2024
- Azman AS, Luquero FJ, Salje H, Mbaïbardoum NN, Adalbert N, Ali M, et al. Micro-hotspots of risk in urban cholera epidemics. J Infect Dis. 2018;218:1164–8. DOIPubMedGoogle Scholar
- Debes AK, Ali M, Azman AS, Yunus M, Sack DA. Cholera cases cluster in time and space in Matlab, Bangladesh: implications for targeted preventive interventions. Int J Epidemiol. 2016;45:2134–9. DOIPubMedGoogle Scholar
- Ratnayake R, Finger F, Azman AS, Lantagne D, Funk S, Edmunds WJ, et al. Highly targeted spatiotemporal interventions against cholera epidemics, 2000-19: a scoping review. Lancet Infect Dis. 2021;21:e37–48. DOIPubMedGoogle Scholar
- Bulit G, Ramos M. Response to cholera outbreaks: case-area targeted interventions (CATI) and community outbreak response teams (CORT) guidelines. New York: UNICEF; 2020. [cited 2024 July 2] https://www.washcluster.net/node/30201
- Ouamba JP, Mbarga NF, Ciglenecki I, Ratnayake R, Tchiasso D, Finger F, et al. Implementation of targeted cholera response activities, Cameroon. Bull World Health Organ. 2023;101:170–8. DOIPubMedGoogle Scholar
- Bompangue D, Moore S, Taty N, Impouma B, Sudre B, Manda R, et al. Description of the targeted water supply and hygiene response strategy implemented during the cholera outbreak of 2017-2018 in Kinshasa, DRC. BMC Infect Dis. 2020;20:226. DOIPubMedGoogle Scholar
- Ingelbeen B, Hendrickx D, Miwanda B, van der Sande MAB, Mossoko M, Vochten H, et al. Recurrent cholera outbreaks, Democratic Republic of the Congo, 2008–2017. Emerg Infect Dis. 2019;25:856–64. DOIPubMedGoogle Scholar
- Gallandat K, Macdougall A, Jeandron A, Mufitini Saidi J, Bashige Rumedeka B, Malembaka EB, et al. Improved water supply infrastructure to reduce acute diarrhoeal diseases and cholera in Uvira, Democratic Republic of the Congo: results and lessons learned from a pragmatic trial. PLoS Negl Trop Dis. 2024;18:
e0012265 . DOIGoogle Scholar - Malembaka EB, Bugeme PM, Hutchins C, Xu H, Hulse JD, Demby MN, et al. Effectiveness of one dose of killed oral cholera vaccine in an endemic community in the Democratic Republic of the Congo: a matched case-control study. Lancet Infect Dis. 2024;24:514–22. DOIPubMedGoogle Scholar
- Kulldorff M, Heffernan R, Hartman J, Assunção R, Mostashari F. A space-time permutation scan statistic for disease outbreak detection. PLoS Med. 2005;2:
e59 . DOIPubMedGoogle Scholar - Lessler J, Salje H, Grabowski MK, Cummings DA. Measuring spatial dependence for infectious disease epidemiology. PLoS One. 2016;11:
e0155249 . DOIPubMedGoogle Scholar - Ratnayake R, Peyraud N, Ciglenecki I, Gignoux E, Lightowler M, Azman AS, et al.; Epicentre and MSF CATI Working Group. Effectiveness of case-area targeted interventions including vaccination on the control of epidemic cholera: protocol for a prospective observational study. BMJ Open. 2022;12:
e061206 . DOIPubMedGoogle Scholar - Maluda MCM, Johnson E, Robinson F, Jikal M, Fong SY, Saffree MJ, et al. The incidence, and spatial trends of cholera in Sabah over 15 years: Repeated outbreaks in coastal areas. PLOS Glob Public Health. 2024;4:
e0002861 . DOIPubMedGoogle Scholar - Gaiffe M, Dross C, Bwenge Malembaka E, Ross I, Cumming O, Gallandat K. A fuzzy inference-based index for piped water supply service quality in a complex, low-income urban setting. Water Res. 2023;243:
120316 . DOIPubMedGoogle Scholar
Figures
Table
Cite This ArticleOriginal Publication Date: July 16, 2024
1These senior authors contributed equally to this article.
Table of Contents – Volume 30, Number 8—August 2024
| EID Search Options |
|---|
|
|
|
|
|
|
Please use the form below to submit correspondence to the authors or contact them at the following address:
Ruwan Ratnayake, London School of Hygiene & Tropical Medicine, Keppel St, London WC1E 7HT, UK
Top