Volume 30, Number 8—August 2024
Research
Environmental Hot Spots and Resistance-Associated Application Practices for Azole-Resistant Aspergillus fumigatus, Denmark, 2020–2023
Figure 3
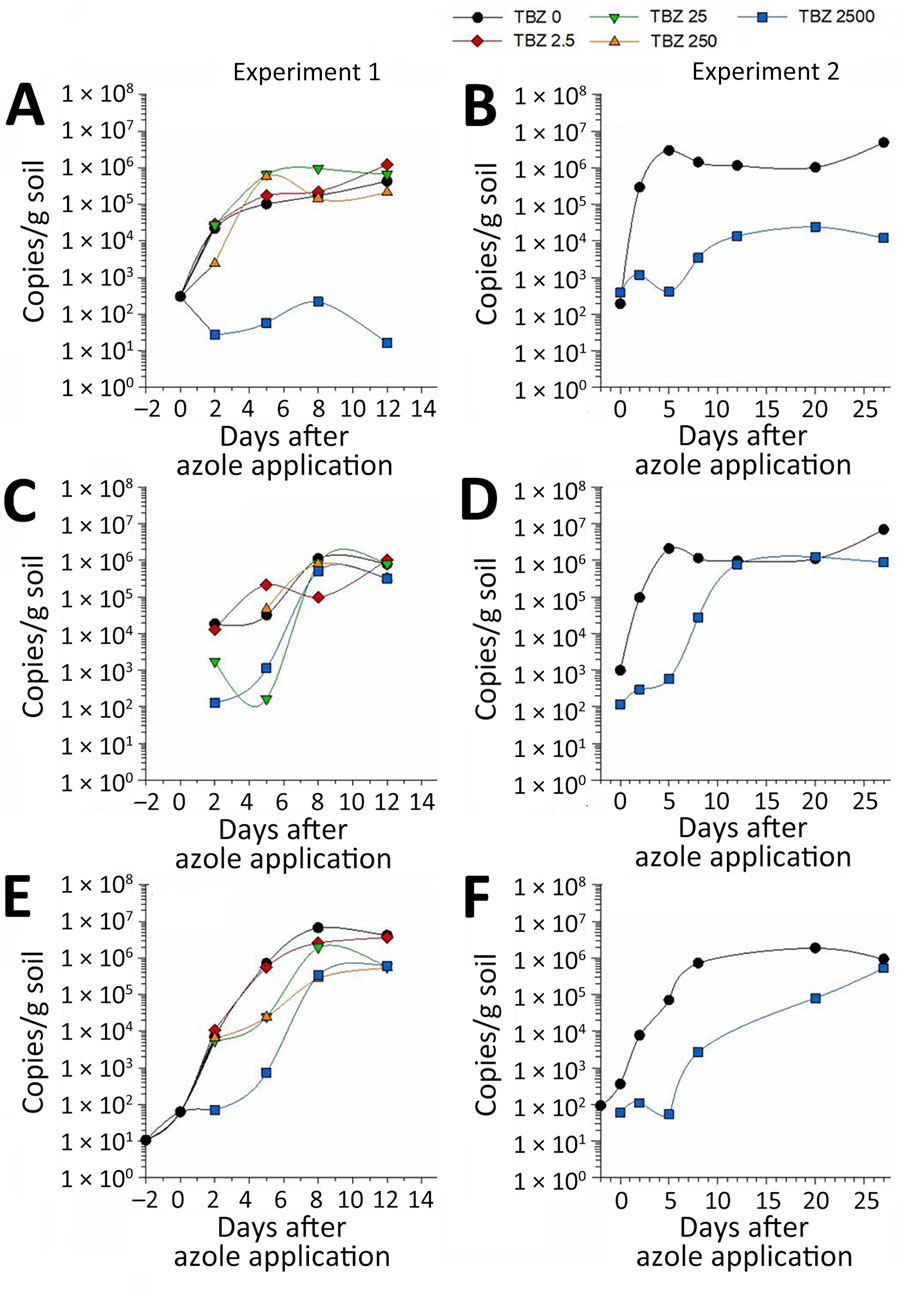
Figure 3. Selective pressure of TBZ on Aspergillus fumigatus wild type (A, B), TR34/L98H (TR34) (C, D), and TR46/Y121F/T289A (TR46) (E, F) in sandy soil (n = 1) in 2 independent microcosmos experiments as part of a study of environmental hot spots and resistance-related application practices for azole-resistant A. fumigatus, Denmark, 2020–2022. In experiment 1, in which 4 different concentrations of tebuconazole were used to spike the microcosmos: 2.5 mg/L (red line), 25 mg/L (green line), 250 mg/L (orange line), and 2,500 mg/L (blue line), and growth was followed over 14 days. Growth was quantified by measuring copies of the cyp51A promoter region by quantitative PCR. Growth was quantified from day −2 after azole application (the day of inoculation) for the untreated samples and from day 2 after azole application for the samples treated with TBZ. In experiment 2, the effect of the 2,500 mg/L treatment was repeated, and growth was followed over 27 days. Growth was quantified from the day of inoculation (2 days before TBZ application) by measuring copies of the cyp51A promoter region by droplet digital PCR. The experiment with TR46/Y121F/T289A was in a different microcosmos trial than for wild type and TR34/L98H but followed the same protocol. TBZ, tebuconazole.