Skip directly to site content Skip directly to page options Skip directly to A-Z link Skip directly to A-Z link Skip directly to A-Z link

Disclaimer: Early release articles are not considered as final versions. Any changes will be reflected in the online version in the month the article is officially released.

Volume 31, Number 2—February 2025
Research

Cyclospora Genotypic Variations and Associated Epidemiologic Characteristics, United States, 2018–2021

John Shen, Vitaliano A. Cama1, David Jacobson, Joel Barratt, and Anne Straily1Comments to Author 
Author affiliation: Oak Ridge Institute for Science and Education, Oak Ridge, Tennessee, USA (J. Shen); Centers for Disease Control and Prevention, Atlanta, Georgia, USA. (J. Shen, V.A. Cama, D. Jacobson, J. Barratt, A. Straily)

Main Article

Figure 3

Heatmaps illustrating the proportions of the top 5 most prevalent CCGs in each of the 7 states with highest number of specimens in study of Cyclospora genotypic variations and associated epidemiologic characteristics United States, 2018–2021. A) New York; B) Texas; C) Florida; D) Illinois; E) Iowa; F) Wisconsin; G) Minnesota. Values within each box represent the percentage of the total number of specimens within a state for a given year. Numbers in parentheses represent the corresponding number of specimens. Darker shades represent higher proportions.  The total number of specimens submitted per year is as follows: New York, 67 (2018), 297 (2019), 110 (2020), 177 (2021); Texas, 98 (2018), 219 (2019), 168 (2020), 66 (2021); Florida 0 (2018), 13 (2019), 90 (2020), 118 (2021); Illinois, 111 (2018), 12 (2019), 73 (2020), 16 (2021); Iowa, 71 (2018), 27 (2019), 87 (2020), 0 (2021); Wisconsin, 123 (2018), 30 (2019), 31 (2020), 40 (2021); Minnesota, 36 (2018), 30 (2019), 95 (2020), 43 (2021). CCG, cluster consensus genotype.

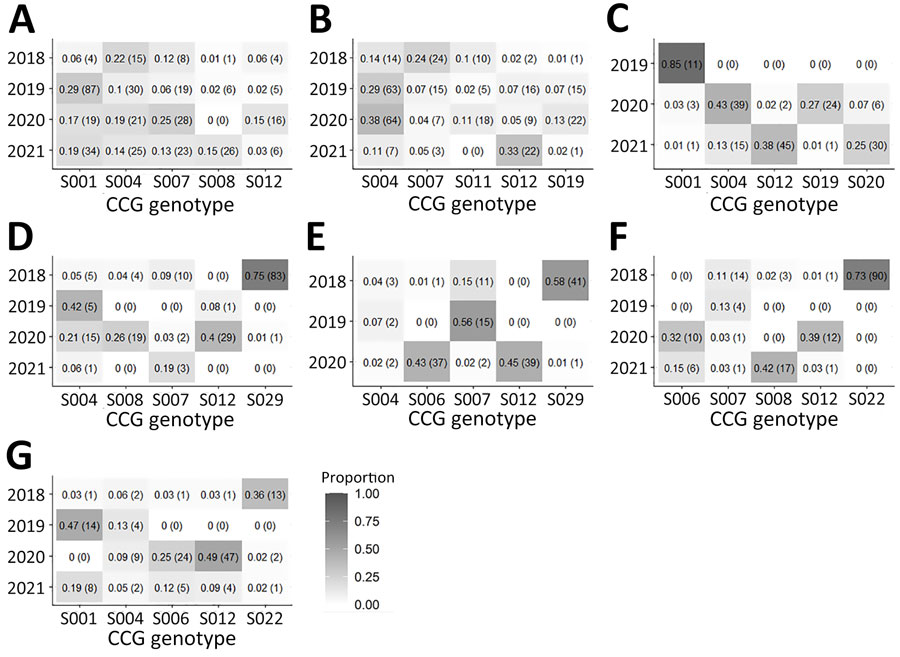
Figure 3. Heatmaps illustrating the proportions of the top 5 most prevalent CCGs in each of the 7 states with highest number of specimens in study of Cyclospora genotypic variations and associated epidemiologic characteristics United States, 2018–2021. A) New York; B) Texas; C) Florida; D) Illinois; E) Iowa; F) Wisconsin; G) Minnesota. Values within each box represent the percentage of the total number of specimens within a state for a given year. Numbers in parentheses represent the corresponding number of specimens. Darker shades represent higher proportions. The total number of specimens submitted per year is as follows: New York, 67 (2018), 297 (2019), 110 (2020), 177 (2021); Texas, 98 (2018), 219 (2019), 168 (2020), 66 (2021); Florida 0 (2018), 13 (2019), 90 (2020), 118 (2021); Illinois, 111 (2018), 12 (2019), 73 (2020), 16 (2021); Iowa, 71 (2018), 27 (2019), 87 (2020), 0 (2021); Wisconsin, 123 (2018), 30 (2019), 31 (2020), 40 (2021); Minnesota, 36 (2018), 30 (2019), 95 (2020), 43 (2021). CCG, cluster consensus genotype.

Main Article

1These senior authors were co–principal investigators.

Page created: December 30, 2024
Page updated: January 22, 2025
Page reviewed: January 22, 2025
The conclusions, findings, and opinions expressed by authors contributing to this journal do not necessarily reflect the official position of the U.S. Department of Health and Human Services, the Public Health Service, the Centers for Disease Control and Prevention, or the authors' affiliated institutions. Use of trade names is for identification only and does not imply endorsement by any of the groups named above.
file_external