Volume 31, Number 2—February 2025
Research
Cyclospora Genotypic Variations and Associated Epidemiologic Characteristics, United States, 2018–2021
Figure 4
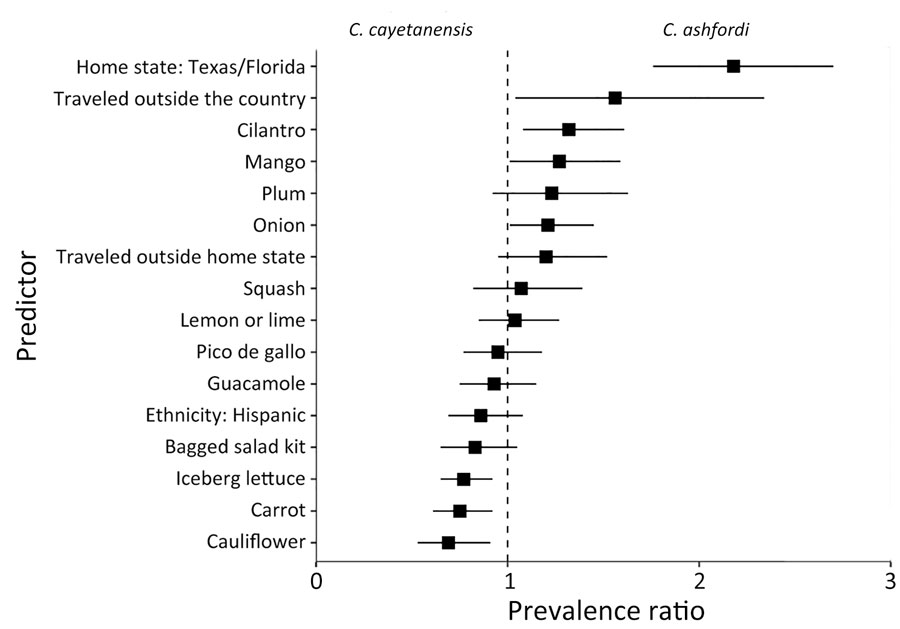
Figure 4. Forest plot presenting prevalence ratio point estimates for all predictors in the generalized estimating equation model in study of Cyclospora genotypic variations and associated epidemiologic characteristics United States, 2018–2021. Prevalence ratios are determined with C. ashfordi as the numerator and C. cayetanensis as the denominator, illustrating the comparative prevalence of these species across the various predictors. Boxes represent prevalence ratio point estimates; whiskers, 95% CI. The dashed line represents a prevalence ratio of 1.
1These senior authors were co–principal investigators.
Page created: December 30, 2024
Page updated: January 31, 2025
Page reviewed: January 31, 2025
The conclusions, findings, and opinions expressed by authors contributing to this journal do not necessarily reflect the official position of the U.S. Department of Health and Human Services, the Public Health Service, the Centers for Disease Control and Prevention, or the authors' affiliated institutions. Use of trade names is for identification only and does not imply endorsement by any of the groups named above.