Volume 31, Number 2—February 2025
Research
Prions in Muscles of Cervids with Chronic Wasting Disease, Norway
Figure 1
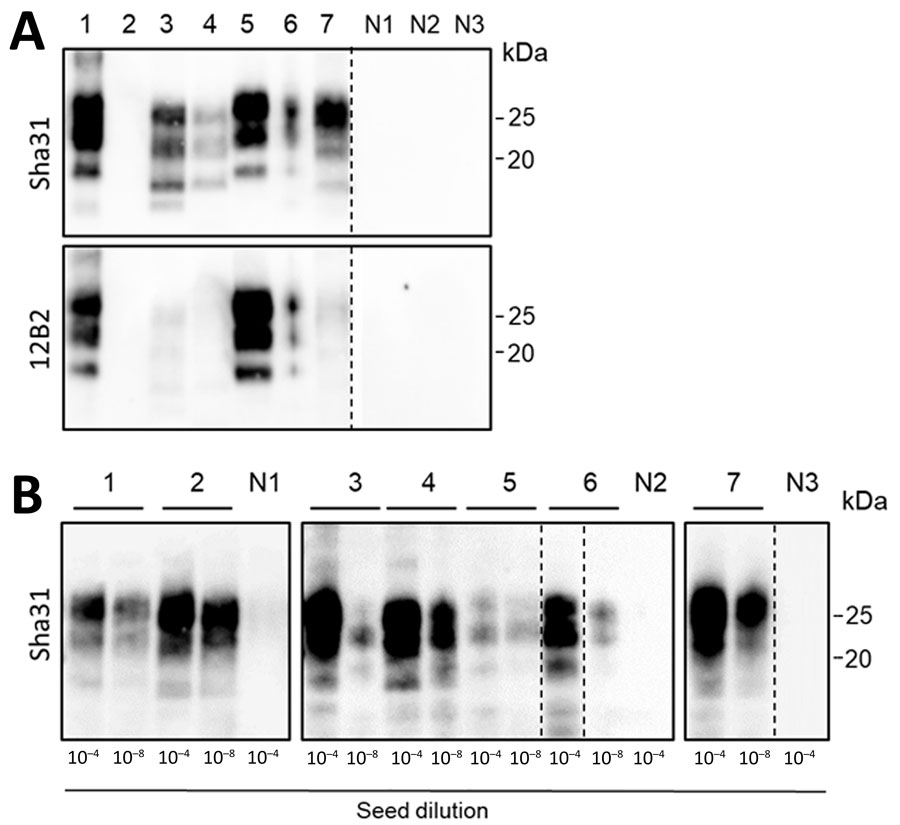
Figure 1. Western blots and protein misfolding cyclic amplification (PMCA; using bank vole substrate) of brain isolates of animals analyzed in a study of prions in muscles of cervids with chronic wasting disease, Norway. A) Western blot analyses of proteinase K–digested brain samples demonstrate the different PrPSc (misfolded forms of the prion protein) molecular profiles of the chronic wasting disease strains present in reindeer, moose (affected by different strains: N-terminally truncated PrPSc in moose A and B, and not N-terminally truncated PrPSc in moose C and D), and a red deer. The PrPres (protease-resistant prion) signal visualized by Sha31 antibody demonstrates the typical electrophoretic migration of PrPSc protein bands, and the 12B2 antibody demonstrates the different cleavages at the N-terminal of the PrP (major prion) protein, which are characteristic for the different strains. B) PMCA amplification of the same brain samples (10−4 and 10−8 dilutions as indicated) using bank vole brain substrate. After 4 rounds of PMCA, amplicons were treated with proteinase K, and PrPres was visualized by Western blot using Sha31 antibody. Our PMCA protocol efficiently amplified prions from all chronic wasting disease–affected samples, regardless of the different strains. No PrPSc amplification was observed in the brain of healthy negative control reindeer (N1), moose (N2), and red deer (N3). Lane designations: 1, reindeer A; 2, reindeer B; 3, moose A; 4, moose B; 5, moose C; 6, moose D; 7, red deer. In panel A, tissue equivalents of 10 mg were loaded for each lane, except lanes 3 (tissue equivalents: 2 mg) and 5 (tissue equivalents: 1 mg). The same quantities of PrPres were loaded for both antibody visualizations. In panel B, equivalent sample volumes were loaded for all lanes. Numbers at the right indicate the molecular weight marker. Dashed lines between images depict membrane splicing.
1These first authors contributed equally to this article.
2These authors are co–senior authors.