Volume 31, Number 3—March 2025
Research
Model-Based Analysis of Impact, Costs, and Cost-effectiveness of Tuberculosis Outbreak Investigations, United States
Figure 2
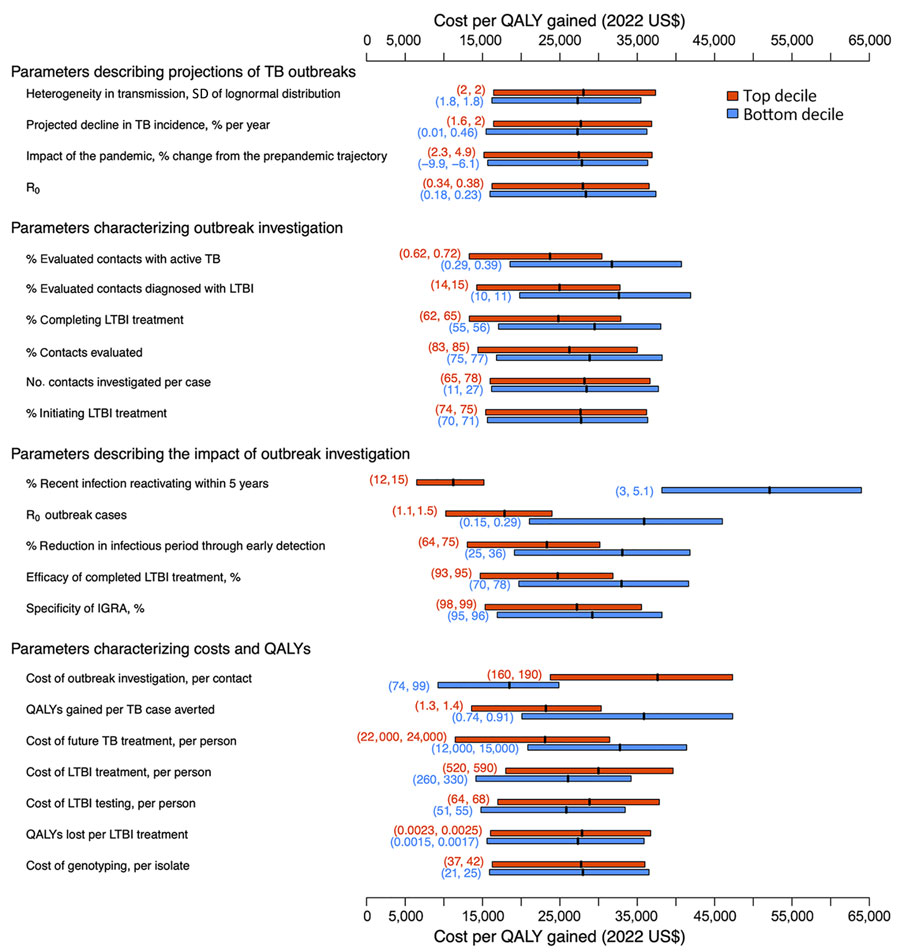
Figure 2. Multivariate sensitivity analysis of the model parameters in study of impact, costs, and cost-effectiveness of TB outbreak investigations, United States. This graph illustrates sensitivity of the incremental cost-effectiveness ratio of TB outbreak investigation in the United States (cost in 2022 US$ per QALY gained, compared with no outbreak investigation) to the values of individual model parameters. Each pair of boxplots shows variation in the outcome when the analysis was limited to either simulations in which the value of the parameter of interest was in the top (red) or bottom (blue) decile of its values across all simulations. The edges of each box represent the lower and upper interquartile range, and the band in the middle represents the mean. The vertical dashed line shows the mean across all simulations ($27,800 per QALY gained, corresponding to the primary outcome). The numbers within parentheses represent the parameter range (up to 2 significant figures) for the top (red) or the bottom (blue) decile. IGRA, interferon-γ release assay; LTBI, latent TB infection; QALY, quality-adjusted life-years; R0, basic reproduction number; TB, tuberculosis.