Long-Term Clinical Outcomes of Adults Hospitalized for COVID-19 Pneumonia
Ivan O. Rosas

, Alejandra Benitez, James A. McKinnell, Reena Shah, Michael Waters, Bradley D. Hunter, Robert Jeanfreau, Larry Tsai, Margaret Neighbors, Ben Trzaskoma, Rita de Cassia Castro, and Fang Cai
Author affiliation: Baylor College of Medicine, Houston, Texas, USA (I.O. Rosas); Genentech, South San Francisco, California, USA (A. Benitez, L. Tsai, M. Neighbors, B. Trzaskoma, R. de Cassia Castro, F. Cai); Torrance Memorial Medical Center, Torrance, California, USA (J.A. McKinnell); Aga Khan University Hospital, Nairobi, Kenya (R. Shah); Velocity Clinical Research, Chula Vista, California, USA (M. Waters); Intermountain Healthcare, Salt Lake City, Utah, USA (B.D. Hunter); Velocity Clinical Research, New Orleans, Louisiana, USA (R. Jeanfreau)
Main Article
Figure 4
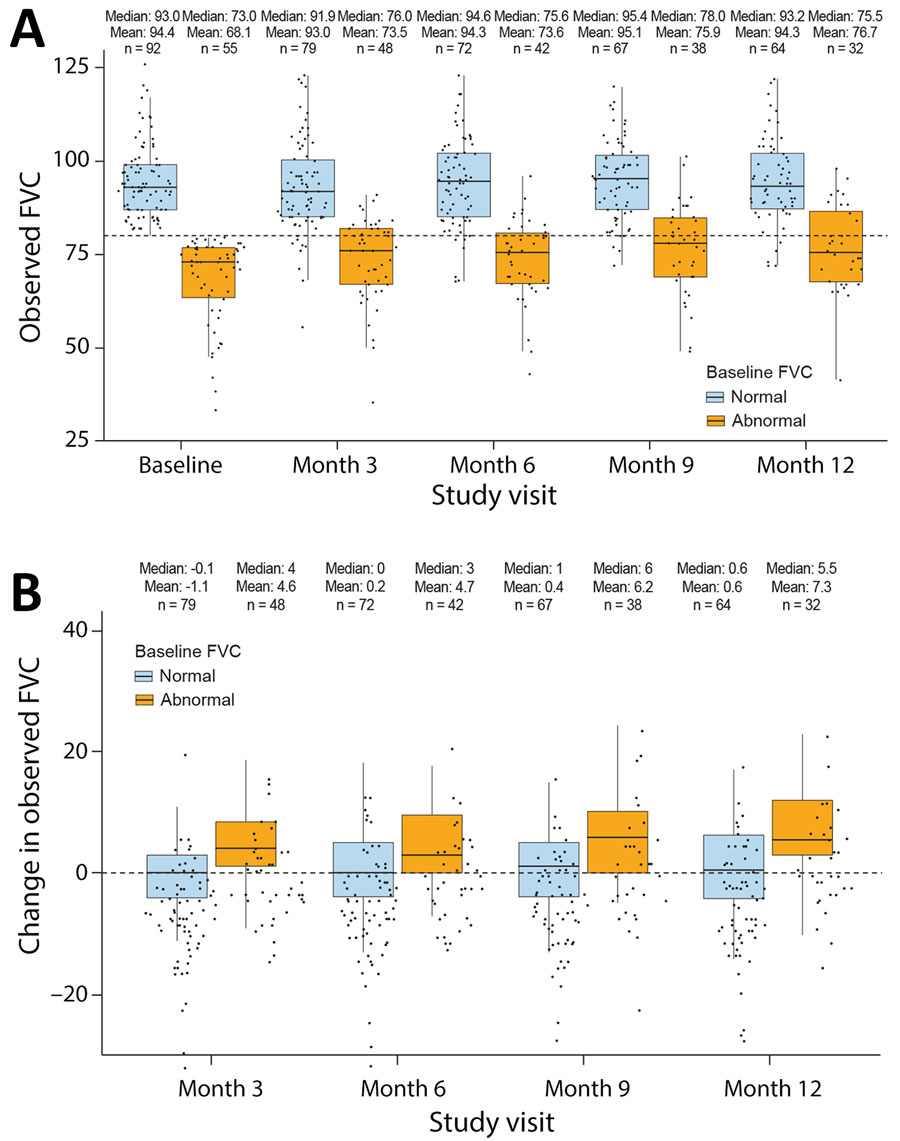
Figure 4. Box plots of longitudinal FVC profiles from the Long-Term Outcomes Post Acute COVID-19 study of adults previously hospitalized for COVID-19 pneumonia. A) Observed percent-predicted FVC at indicated study visits. B) Change in percent-predicted FVC at different study visits according to the baseline FVC. Dashed horizonal lines indicate 80% predicted FVC (A) and no change in percent-predicted FVC (B). Horizontal lines within boxes indicate medians; box tops and bottoms indicate upper (third) and lower (first) quartiles; error bars (whiskers) indicate 1.5 times interquartile range.. Dots indicate data points; data points beyond the end of the whiskers are considered outliers. Numbers above the bars indicate mean and median percent-predicted FVC and total number of participants in category. Abnormal is defined as <80% and normal ≥80% predicted FVC. FVC, forced vital capacity.
Main Article
Page created: March 24, 2025
Page updated: June 09, 2025
Page reviewed: June 09, 2025
The conclusions, findings, and opinions expressed by authors contributing to this journal do not necessarily reflect the official position of the U.S. Department of Health and Human Services, the Public Health Service, the Centers for Disease Control and Prevention, or the authors' affiliated institutions. Use of trade names is for identification only and does not imply endorsement by any of the groups named above.