Skip directly to site content Skip directly to page options Skip directly to A-Z link Skip directly to A-Z link Skip directly to A-Z link

Disclaimer: Early release articles are not considered as final versions. Any changes will be reflected in the online version in the month the article is officially released.

Volume 31, Number 6—June 2025

Research

Long-Term Clinical Outcomes of Adults Hospitalized for COVID-19 Pneumonia

Ivan O. RosasComments to Author , Alejandra Benitez, James A. McKinnell, Reena Shah, Michael Waters, Bradley D. Hunter, Robert Jeanfreau, Larry Tsai, Margaret Neighbors, Ben Trzaskoma, Rita de Cassia Castro, and Fang Cai
Author affiliation: Baylor College of Medicine, Houston, Texas, USA (I.O. Rosas); Genentech, South San Francisco, California, USA (A. Benitez, L. Tsai, M. Neighbors, B. Trzaskoma, R. de Cassia Castro, F. Cai); Torrance Memorial Medical Center, Torrance, California, USA (J.A. McKinnell); Aga Khan University Hospital, Nairobi, Kenya (R. Shah); Velocity Clinical Research, Chula Vista, California, USA (M. Waters); Intermountain Healthcare, Salt Lake City, Utah, USA (B.D. Hunter); Velocity Clinical Research, New Orleans, Louisiana, USA (R. Jeanfreau)

Main Article

Figure 5

Longitudinal profiles of patient-reported outcomes from the Long-Term Outcomes Post Acute COVID-19 study of adults previously hospitalized for COVID-19 pneumonia. A) Box plots indicate quality of life assessed by SF-36v2 (Quality Metric, https://www.qualitymetric.com). SF-36v2 scores (range 0–100 points) were summarized by using the median for each of the 8 indicated domains indicated. Normal was defined as a score of >50 points for each domain. Median percentages of participants within each domain are indicated at the top. Horizontal lines within boxes indicate medians; box tops and bottoms indicate upper (third) and lower (first) quartiles; error bars (whiskers) indicate minimum and maximum values. Closed circles indicate outliers. B) Symptoms of study participants assessed by the Modified Living With Pulmonary Fibrosis Assessment Tool. Data are shown as no. (%) participants experiencing each category of symptoms according to 173 enrolled participants. Baseline refers to study baseline (time of enrollment). Questionnaire responses were summarized by using mean patient-reported scores for each symptom domain: dyspnea (7 questions), coughing (5 questions), and fatigue (3 questions). Scores ranged from 0 to 3; the lowest score corresponds to no symptoms and the higher score corresponds to greater symptom severity. SF-36v2, Short Form 36 Question Health Survey version 2.

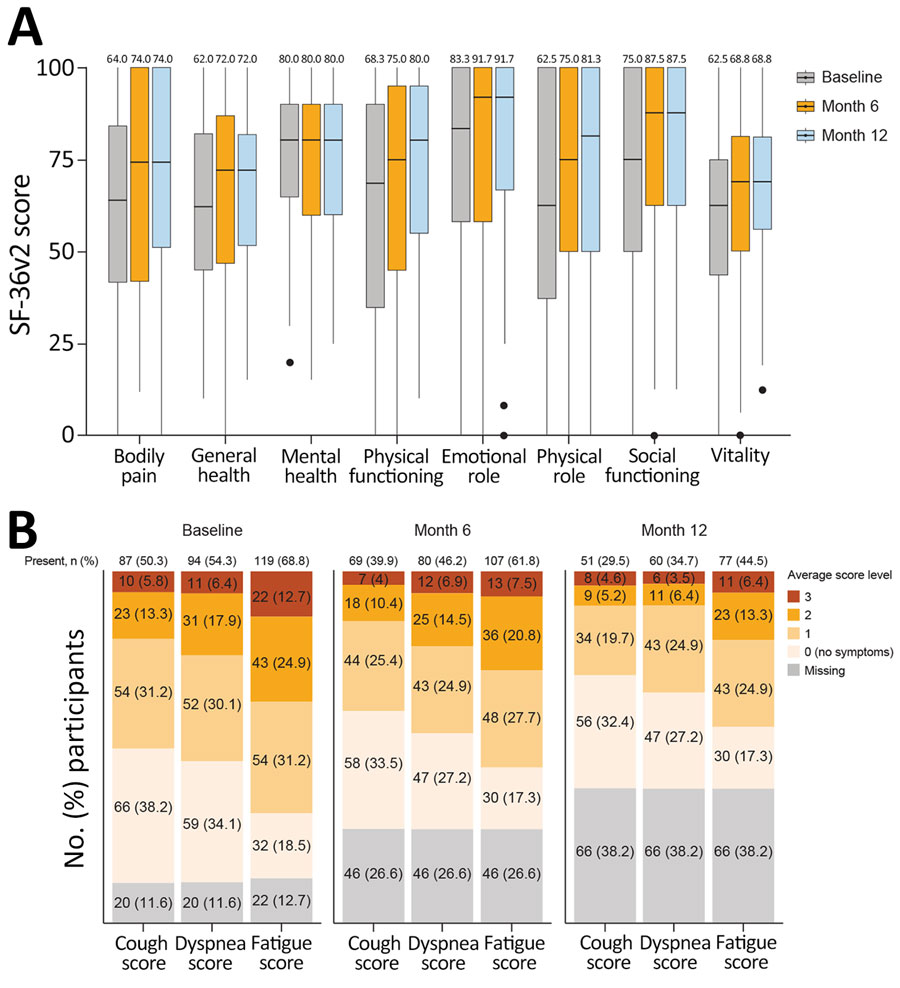
Figure 5. Longitudinal profiles of patient-reported outcomes from the Long-Term Outcomes Post Acute COVID-19 study of adults previously hospitalized for COVID-19 pneumonia. A) Box plots indicate quality of life assessed by SF-36v2 (Quality Metric, https://www.qualitymetric.com). SF-36v2 scores (range 0–100 points) were summarized by using the median for each of the 8 indicated domains indicated. Normal was defined as a score of >50 points for each domain. Median percentages of participants within each domain are indicated at the top. Horizontal lines within boxes indicate medians; box tops and bottoms indicate upper (third) and lower (first) quartiles; error bars (whiskers) indicate minimum and maximum values. Closed circles indicate outliers. B) Symptoms of study participants assessed by the Modified Living With Pulmonary Fibrosis Assessment Tool. Data are shown as no. (%) participants experiencing each category of symptoms according to 173 enrolled participants. Baseline refers to study baseline (time of enrollment). Questionnaire responses were summarized by using mean patient-reported scores for each symptom domain: dyspnea (7 questions), coughing (5 questions), and fatigue (3 questions). Scores ranged from 0 to 3; the lowest score corresponds to no symptoms and the higher score corresponds to greater symptom severity. SF-36v2, Short Form 36 Question Health Survey version 2.

Main Article

Page created: March 24, 2025
Page updated: May 20, 2025
Page reviewed: May 20, 2025
The conclusions, findings, and opinions expressed by authors contributing to this journal do not necessarily reflect the official position of the U.S. Department of Health and Human Services, the Public Health Service, the Centers for Disease Control and Prevention, or the authors' affiliated institutions. Use of trade names is for identification only and does not imply endorsement by any of the groups named above.
file_external