Volume 32, Number 10—October 2026
Research
Detection of Influenza D Virus using Reverse Transcription Loop-Mediated Isothermal Amplification
Carlos Abelardo dos Santos, Jialu Li, Pauline M. van Diemen, Andrew McMahon, Benjamin C. Mollett, Andrew M. Ramsay, Meshach M. Maina, Joe James, Helen E. Everett, Janet M. Daly, and Nicole C. Robb
Figure 5
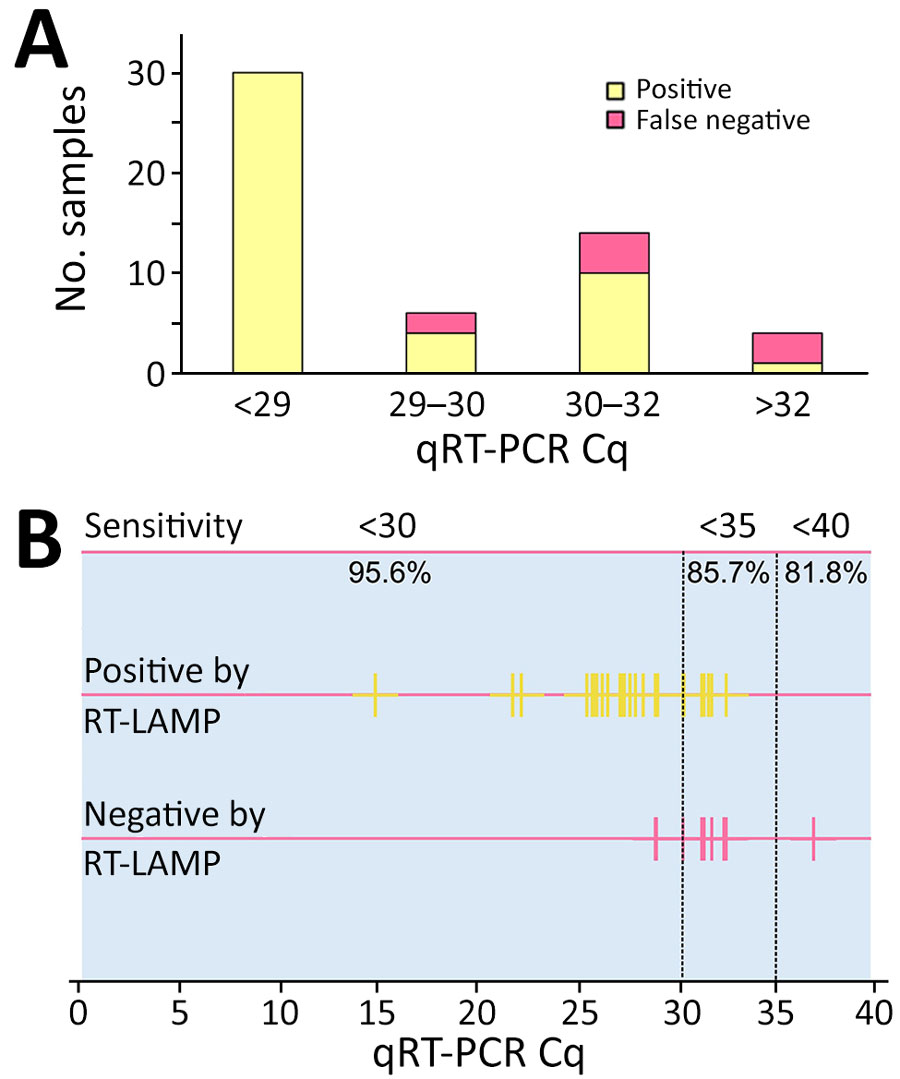
Figure 5. Sensitivity of RT-LAMP assay in relation to qRT-PCR Cq in study of isothermal detection of influenza D virus using RT-LAMP. A) Detection of spiked samples detected by RT-LAMP in relation to the Cq value. B) Each true positive sample was sorted according to its Cq value and RT-LAMP result. Yellow lines along the top line were positive by both RT-LAMP and qRT-PCR, pink lines on the lower line were positive by qRT-PCR but negative by RT-LAMP. The sensitivity of each range is presented as percentages at the top of the graph. Cq, cycle quantification; RT-LAMP, reverse transcription loop-mediated isothermal amplification; qRT-PCR, quantitative reverse transcription PCR.
Page created: August 13, 2026
Page updated: September 28, 2026
Page reviewed: September 28, 2026
The conclusions, findings, and opinions expressed by authors contributing to this journal do not necessarily reflect the official position of the U.S. Department of Health and Human Services, the Public Health Service, the Centers for Disease Control and Prevention, or the authors' affiliated institutions. Use of trade names is for identification only and does not imply endorsement by any of the groups named above.