Volume 32, Number 3—March 2026
Research
Seroincidence Rate of Typhoidal Salmonella in Children, Kenya, 2017–2018
Aslam Khan , Polina Kamenskaya, Izabela Rezende, Francis M. Mutuku, Bryson Ndenga, Zainab Jembe, Priscilla Maina, Philip Chebii, Charles Ronga, Victoria Okuta, Denise O. Garrett, Donal Bisanzio, Kristen Aiemjoy, Jason R. Andrews, A. Desiree LaBeaud1, and Richelle Charles1
Figure 4
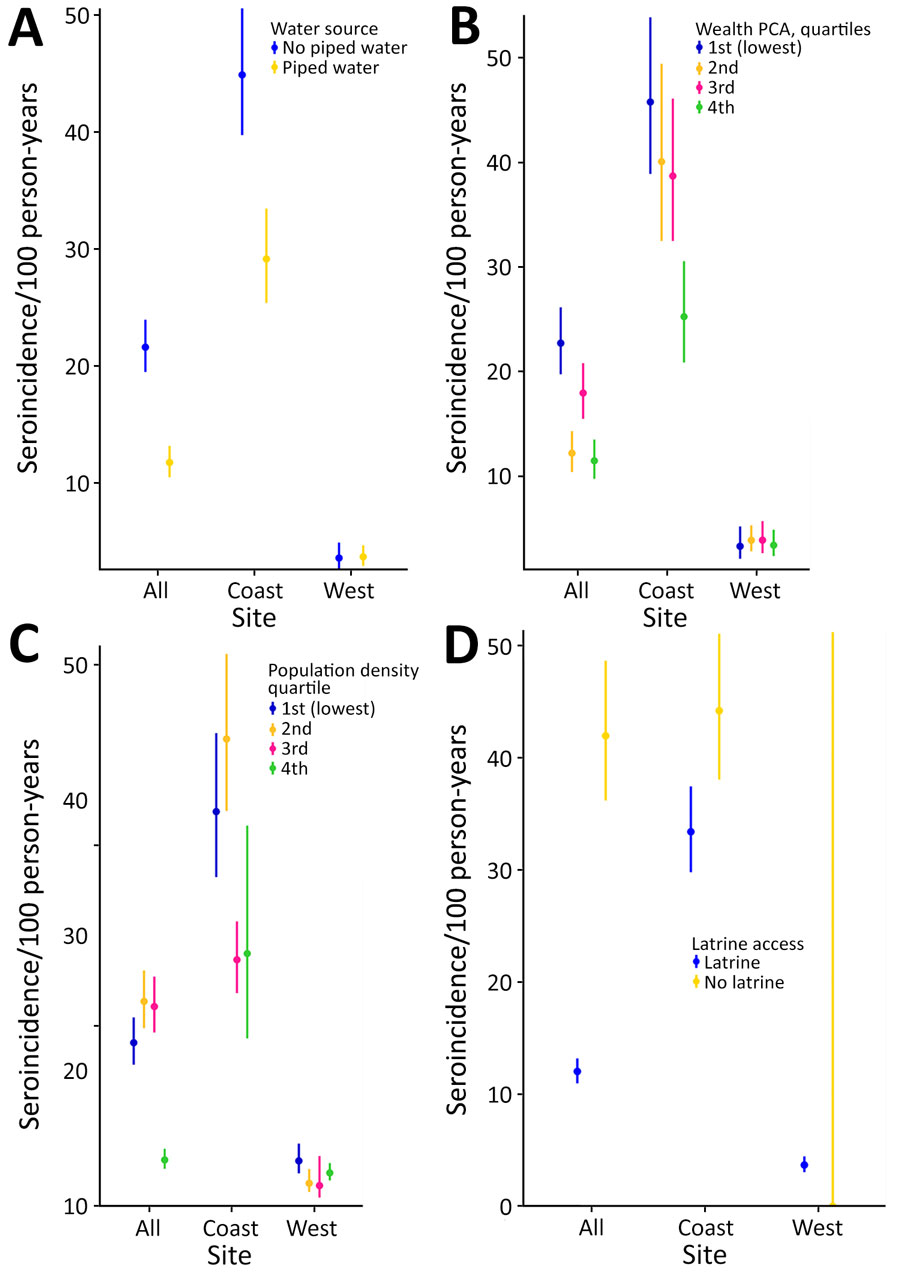
Figure 4. Typhoidal Salmonella seroincidence by site characteristics in study of typhoidal Salmonella in children, Kenya, 2017–2018. A) Seroincidence by water source. B) Seroincidence stratified by wealth. C) Seroincidence stratified by population density. D) Seroincidence by latrine type. Dots represent medians; error bars indicate 95% CIs. PCA, principal component analysis.
1These senior authors contributed equally to this article.
Page created: February 13, 2026
Page updated: March 20, 2026
Page reviewed: March 20, 2026
The conclusions, findings, and opinions expressed by authors contributing to this journal do not necessarily reflect the official position of the U.S. Department of Health and Human Services, the Public Health Service, the Centers for Disease Control and Prevention, or the authors' affiliated institutions. Use of trade names is for identification only and does not imply endorsement by any of the groups named above.