Volume 17, Number 9—September 2011
Research
Classical Bovine Spongiform Encephalopathy by Transmission of H-Type Prion in Homologous Prion Protein Context
Figure 2
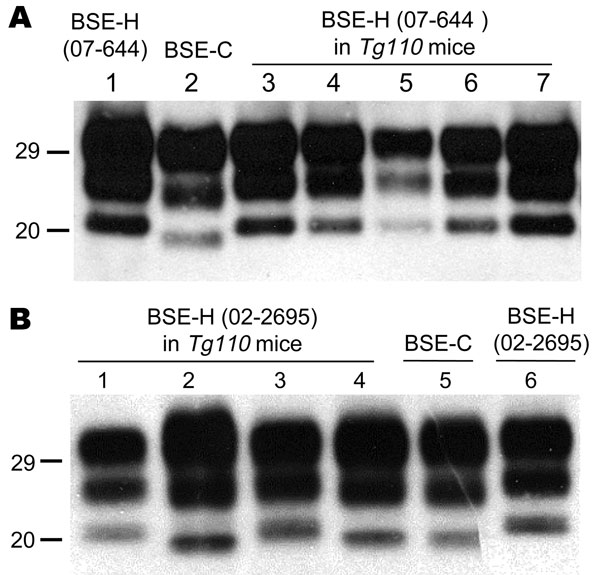
Figure 2. Western blot analyses of brain protease-resistant prion protein (PrPres) from BSE-H infected mice by using Sha31 monoclonal antibody. A) Mice infected with isolate 07-644 at first passage (lanes 3–7) showing a homogeneous high-type (H-type) PrPres molecular profile; BSE-H isolate 07-644 (lane 1) and a BSE-C isolate (lane 2) were included for comparison. B) Mice infected with isolate 02-2695 at first passage showing either H-type (lanes 1 and 3) or classical BSE–like (C-like) PrPres molecular profile (lanes 2 and 4); BSE-H isolate 02-2695 (lane 6) and a BSE-C isolate (lane 5) were included for comparison. In panel B, a 10-fold equivalent brain tissue mass was loaded for brains from mice showing H-type PrPres molecular profile (lanes 1 and 3) than from those with a C-like PrPres molecular profile (lanes 2 and 4) to obtain equivalent PrPres signals. Values to the left indicate molecular mass in kDa. BSE, bovine spongiform encephalopathy; BSE-H, unglycosylated PrPres that is higher than BSE-C; BSE-C, classical BSE.