Volume 22, Number 1—January 2016
Research
Human Papillomavirus Prevalence and Herd Immunity after Introduction of Vaccination Program, Scotland, 2009–2013
Ross L. Cameron , Kimberley Kavanagh, Jiafeng Pan, John Love, Kate Cuschieri, Chris Robertson, Syed Ahmed, Timothy Palmer, and Kevin G.J. Pollock
Figure
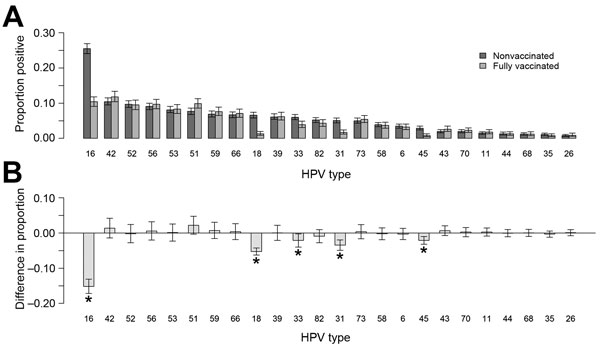
Figure. Analyses for 5,715 liquid-based cytology cervical samples from vaccinated and nonvaccinated women, for which valid human papillomavirus (HPV) testing results were available, Scotland, 2009–2013. A) Proportion and 95% CIs for samples with positive results for each HPV type. B) Difference in the proportion positive and associated 95% CIs for the difference between vaccinated and nonvaccinated women, by HPV type. Other than HPV types 16 and 18, the 95% CIs of the difference were corrected for multiple testing using by using the Bonferroni correction. *Significant change.
Page created: December 18, 2015
Page updated: December 18, 2015
Page reviewed: December 18, 2015
The conclusions, findings, and opinions expressed by authors contributing to this journal do not necessarily reflect the official position of the U.S. Department of Health and Human Services, the Public Health Service, the Centers for Disease Control and Prevention, or the authors' affiliated institutions. Use of trade names is for identification only and does not imply endorsement by any of the groups named above.