Volume 22, Number 12—December 2016
Synopsis
Assessing the Epidemic Potential of RNA and DNA Viruses
Mark E.J. Woolhouse , Liam Brierley, Chris McCaffery, and Sam Lycett
Figure 2
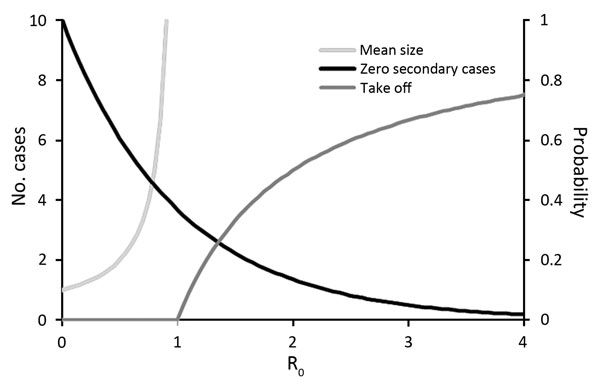
Figure 2. Expected outbreak dynamics for RNA and DNA viruses given a single primary case in a large, previously unexposed host population, as a function of the basic reproduction number R0. Mean size of outbreak as total number of cases (N) is given by N = 1/(1 − R0) for R0<1 (light gray line, left axis). Probability of 0 secondary cases (i.e., outbreak size N = 1) is given by P1 = exp(−R0) (black line, right axis). Probability of a major outbreak is given by Ptakeoff = 1 – 1/R0 for R0>1 (dark gray line, right axis).
Page created: November 17, 2016
Page updated: November 17, 2016
Page reviewed: November 17, 2016
The conclusions, findings, and opinions expressed by authors contributing to this journal do not necessarily reflect the official position of the U.S. Department of Health and Human Services, the Public Health Service, the Centers for Disease Control and Prevention, or the authors' affiliated institutions. Use of trade names is for identification only and does not imply endorsement by any of the groups named above.