Volume 23, Number 1—January 2017
Research
Estimated Incidence of Antimicrobial Drug–Resistant Nontyphoidal Salmonella Infections, United States, 2004–2012
Cite This Article
Citation for Media
Abstract
Salmonella infections are a major cause of illness in the United States. The antimicrobial agents used to treat severe infections include ceftriaxone, ciprofloxacin, and ampicillin. Antimicrobial drug resistance has been associated with adverse clinical outcomes. To estimate the incidence of resistant culture-confirmed nontyphoidal Salmonella infections, we used Bayesian hierarchical models of 2004–2012 data from the Centers for Disease Control and Prevention National Antimicrobial Resistance Monitoring System and Laboratory-based Enteric Disease Surveillance. We based 3 mutually exclusive resistance categories on susceptibility testing: ceftriaxone and ampicillin resistant, ciprofloxacin nonsusceptible but ceftriaxone susceptible, and ampicillin resistant but ceftriaxone and ciprofloxacin susceptible. We estimated the overall incidence of resistant infections as 1.07/100,000 person-years for ampicillin-only resistance, 0.51/100,000 person-years for ceftriaxone and ampicillin resistance, and 0.35/100,000 person-years for ciprofloxacin nonsusceptibility, or ≈6,200 resistant culture-confirmed infections annually. These national estimates help define the magnitude of the resistance problem so that control measures can be appropriately targeted.
Each year in the United States, nontyphoidal Salmonella causes an estimated 1.2 million illnesses, 23,000 hospitalizations, and 450 deaths (1). Antimicrobial drug–resistant Salmonella is a serious threat to public health (2). Salmonella infections have been linked to a variety of sources, particularly foods of animal origin (e.g., beef, poultry, eggs, dairy products) and produce (3–5). Most antimicrobial drug–resistant nontyphoidal Salmonella infections are caused by 4 of the 5 serotypes most commonly isolated during 2004–2012: Typhimurium, Enteritidis, Newport, and Heidelberg (6–10). The predominance of these 4 serotypes reflects their ability to persist in food animals, be transmitted through the food supply, and cause illness in humans (10,11).
Most nontyphoidal Salmonella infections do not require antimicrobial treatment. However, treatment is recommended for severe infections, including invasive illnesses such as bacteremia and meningitis (12). Third-generation cephalosporins (e.g., ceftriaxone) and fluoroquinolones (e.g., ciprofloxacin) are empirically used to treat severe nontyphoidal Salmonella infections. Because fluoroquinolones are not routinely prescribed for children, third-generation cephalosporins are particularly important for use in children. Ampicillin remains a useful agent for treating infections documented as susceptible (12–14). Adverse clinical outcomes (e.g., increased rates of hospitalization, bloodstream infection, invasive illness, and death) have been associated with resistant infections, and treatment failures have been reported for infections with reduced susceptibility to ciprofloxacin (5,15–19).
Estimates of the incidence of resistant Salmonella infections are needed to inform policy decisions. The National Antimicrobial Resistance Monitoring System (NARMS) monitors resistance among salmonellae by testing samples of isolates from ill persons and determining the percentage of isolates that display resistance (8,9). For extrapolation from resistance percentages to incidence of resistant infections, the incidence of Salmonella infections must be known. Salmonella incidence data for this calculation are provided by the National Laboratory-based Enteric Disease Surveillance (LEDS) system (6). Serotype Heidelberg provides an illustration of why estimates of the incidence of resistant infections are needed. During 2004–2012, the percentage of ceftriaxone-resistant isolates increased from 9% to 22% (8,9). At the same time, the incidence of Heidelberg infections declined from 0.60 to 0.31 infections/100,000 population (6). Thus, to assess whether the incidence of resistant Heidelberg infections is changing, estimates of the incidence of resistant Heidelberg infections are needed. Using Bayesian hierarchical models of resistance percentages and Salmonella incidence with data from the 2 surveillance systems, we estimated the incidence of culture-confirmed infections caused by nontyphoidal Salmonella with resistance to ceftriaxone, nonsusceptibility to ciprofloxacin, and resistance to ampicillin and provide such estimates for major serotypes (20). We describe this modeling approach of combining data from the 2 systems to obtain improved estimates and measures of uncertainties.
LEDS
Clinical laboratories send Salmonella isolated from humans to public health laboratories in 50 states and many local health departments for serotyping (6). Culture-confirmed Salmonella isolates are reported to the Centers for Disease Control and Prevention (CDC) through LEDS (6). Excluded from this report are serotypes Typhi and Paratyphi, for which the only reservoir is humans and which account for <1% of Salmonella infections in the United States (6,11,12). Hereafter, we use the term Salmonella to refer to nontyphoidal Salmonella.
NARMS
NARMS is a collaboration among CDC, the US Food and Drug Administration (FDA), the US Department of Agriculture, and state and local health departments. NARMS monitors resistance among enteric bacteria isolated from humans, retail meat, and food animals (8,9). Public health laboratories of 50 state and 4 local health departments submit a subset (every 20th) of Salmonella isolates that they receive from clinical laboratories to the CDC NARMS for susceptibility testing (8,9).
From 2004 through 2012, CDC tested Salmonella isolates for susceptibility to agents representing 8–9 classes of antimicrobial agents. MICs were determined by broth microdilution (Sensititer; Trek Diagnostics, Westlake, OH, USA) and interpreted by using criteria from the Clinical and Laboratory Standards Institute when available (8,19). We defined ceftriaxone resistance as MIC >4 μg/mL, ampicillin resistance as MIC >32 μg/mL, and nonsusceptibility to ciprofloxacin as MIC >0.12 μg/mL; the latter includes resistant and intermediate categories defined by the Clinical and Laboratory Standards Institute (8,19).
Resistance Categories for Estimation of Resistance Incidence
Figure 1

Figure 1. Number of nontyphoidal Salmonella isolates with clinically important resistance, by resistance category, United States, 2004–2012. Three mutually exclusive categories were defined. Isolates in each category may have resistance to other agents:...
We defined 3 mutually exclusive categories of clinically important resistance according to results of testing for ceftriaxone, ciprofloxacin, and ampicillin (Figure 1) (8,19): ceftriaxone/ampicillin resistance indicates resistance to ceftriaxone and ampicillin (because all ceftriaxone-resistant isolates are ampicillin resistant); ciprofloxacin nonsusceptibility indicates nonsusceptibility to ciprofloxacin but susceptibility to ceftriaxone; and ampicillin-only resistance indicates resistance to ampicillin but susceptibility to ceftriaxone and ciprofloxacin. Isolates in each category may be resistant to other agents. Hereafter, we refer to any resistance included in any of these 3 clinically important categories as overall resistance. Unlike the 2013 CDC report, which includes estimates for resistance to >5 antimicrobial drug classes, we focused on the 3 agents used to treat invasive infections (2).
Bayesian Hierarchical Model
We used 2004–2012 data from NARMS, LEDS, and the US Census Bureau as input in the Bayesian hierarchical model (6,8,21). From NARMS, we used resistance proportions calculated as the number of resistant isolates divided by the number of isolates tested per state and year (state-year). We included only fully serotyped isolates. From LEDS, we used the number of culture-confirmed infections reported for state-year. We included all LEDS isolates; for each state, the serotypes of nonserotyped and partially serotyped isolates were imputed on the basis of the observed proportions of 5 serotype categories (Typhimurium, Enteritidis, Newport, Heidelberg, and other) among fully serotyped isolates over the 9 years. We used US Census population data for each state-year to express incidence (infections per 100,000 persons per year [person-years]).
In the Bayesian hierarchical model, we assumed normal distribution for LEDS Salmonella incidence data and binomial distribution for NARMS data. The Bayesian hierarchical model of Salmonella incidence and resistance data incorporated state, year, and state-year interaction effects. State and year effects used borrowed strength from contiguous states and previous years. Borrowed strength refers to the idea that quantities of interest are related to each other, and information on one can provide information on another (22). We excluded Alaska and Hawaii because they are distant from the 48 contiguous states and so the Bayesian hierarchical model could not be well applied. We excluded the District of Columbia because it did not begin submitting isolates to NARMS until 2008 (9). In preliminary analyses, we reviewed LEDS Salmonella incidence data by state-year to identify outliers that may need modeling adjustments, knowing that some states do not routinely receive all isolates from clinical laboratories (6). The models are described in the Technical Appendix.
We generated Bayesian hierarchical model posterior estimates of Salmonella infection incidence rates, resistance proportions, and resistant infection incidence rates (resistance incidence) by state-year for each of the 5 serotype categories by using Markov chain Monte Carlo simulations (22–24). State-year resistance incidence estimates, expressed per 100,000 person-years, were calculated as follows: ([estimated number of infections for state-year/census population for state-year] × 100,000) × (estimated resistance proportion for state-year). We calculated the means of the 48 state-year mean posterior estimates for each of the 9 study years. We generated overall estimates for 2004–2012 by calculating means and 95% credible intervals (CrIs) from the 9-year mean estimates. We used 2.5th and 97.5th percentiles of 5,000 samples of posterior estimates for the 95% CrIs. For each of the 5 serotype categories, we estimated resistance incidence for the mutually exclusive categories and derived overall resistance incidence estimates by summing them. For all Salmonella, estimates were calculated by summing estimates derived for the 5 serotype categories.
As part of model fitting, we plotted observed versus Bayesian hierarchical model–derived (predicted) estimates of Salmonella infection incidence, resistance proportion, and resistance incidence by state-year for the 5 serotype categories by resistance category. We assessed the shrinkage of resistance proportions (observed vs. predicted values) related to the number of isolates tested; shrinkage refers to an estimation scheme that borrows strength from related quantities to adjust individual estimates (online Technical Appendix) (25). To assess fluctuations over the 9 years of the study, we derived mean estimates and 95% CrIs for 3-year periods (2004–2006, 2007–2009, and 2010–2012) by using an even split of time for simplicity.
Overall Salmonella Infection and Resistance Surveillance Data
From 2004 through 2012, the 48 contiguous states reported 369,254 culture-confirmed Salmonella infections to LEDS. The periods 2004–2006, 2007–2009, and 2010–2012 accounted for 30%, 33%, and 37% of infections, respectively. Among the isolates from these infections, 87% were serotyped as follows: Enteritidis (19%), Typhimurium (18%), Newport (11%), Heidelberg (4%), and all other serotypes (48%). The remaining 13% were not fully serotyped. These 4 primary serotypes, which were among the 5 most commonly reported to LEDS overall, accounted for 52% of fully serotyped isolates. Of the 48 states, <2% of isolates were not fully serotyped for 10 states, 2%–10% for 27 states, 11%–29% for 5 states, and >62% for 6 states.
From 2004 through 2012, NARMS tested 19,410 Salmonella isolates from the 48 states for resistance. The periods 2004–2006, 2007–2009, and 2010–2012 accounted for 30%, 34%, and 36% of isolates, respectively. Most (98%) were fully serotyped as follows: Enteritidis (18%), Typhimurium (17%), Newport (11%), Heidelberg (4%), and other (49%). These 4 primary serotypes, which were among the 5 most common among isolates submitted to NARMS overall, accounted for 51% of fully serotyped isolates. Of the 48 states, <2% of isolates were not fully serotyped for 31 states, 2%–8% for 15 states, and >86% for 2 states.
Overall resistance was detected in 2,320 (12%) isolates. Ampicillin-only resistance was the most common pattern, detected in 1,254 (6.5%) isolates, of which 60% were Typhimurium (Table 1; Figure 1). Ceftriaxone/ampicillin resistance was detected in 599 (3.1%) isolates, of which 33% were Newport, 27% Typhimurium, and 15% Heidelberg. Ciprofloxacin nonsusceptibility was detected in 467 (2.4%) isolates, of which 20% were resistant to ampicillin and 45% were Enteritidis. Only 38 (0.2%) isolates were both resistant to ceftriaxone and nonsusceptible to ciprofloxacin; these were included only in the ceftriaxone/ampicillin resistance category. Most isolates with ceftriaxone/ampicillin resistance, ciprofloxacin nonsusceptibility, or ampicillin-only resistance showed resistance to other agents tested (Figure 1) (9). The 4 serotypes accounted for 73% of 2,320 isolates with any clinically important resistance. The percentages of isolates with ciprofloxacin nonsusceptibility and ampicillin-only resistance among not fully serotyped isolates were similar to those among all Salmonella.
Surveillance and Resistance Data by State and Year
All 48 states reported Salmonella infections to LEDS. Not all states reported infections every year: 47 reported any Salmonella, 44 reported Typhimurium, 45 reported Enteritidis, 43 reported Newport, and 39 reported Heidelberg. Many states had wide fluctuations in the annual overall incidence, ranging from 3.1 (Florida) to 28.4 (Mississippi) infections/100,000 person-years.
All 48 states submitted Salmonella isolates to NARMS. Not all states submitted isolates every year: 44 submitted any Salmonella, 32 submitted Typhimurium, 31 submitted Enteritidis, 23 submitted Newport, and 5 submitted Heidelberg. For Heidelberg and many less common serotypes, small numbers of isolates were tested; in isolates from many states, low or no resistance was detected (e.g., no ceftriaxone resistance among 109 Heidelberg isolates from 19 states). However, very high resistance was assigned to some states for which small numbers were tested (e.g., 1 ceftriaxone-resistant of only 1 tested).
Model Estimates of Annual Resistance Incidence by State
Rates of Salmonella incidence in Florida were much lower than those from its 6 closest states. We adjusted for this finding in the Bayesian hierarchical model (online Technical Appendix).
Figure 2
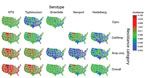
Figure 2. Estimated incidence of infection with all NTS and major serotypes with clinically important resistance (no. infections per 100,000 person-years), by state and resistance category, United States, 2004–2012. Estimates were derived by...
For the 48 states, mean resistance incidence, estimated by serotype and resistance category, varied geographically (Figure 2). For all Salmonella, rates (infections per 100,000 person-years) ranged as follows: 0.88–4.69 (median 1.81) for overall resistance; 0.45–2.95 (median 0.94) for ampicillin-only resistance; 0.15–2.20 (median 0.38) for ceftriaxone/ampicillin resistance; and 0.11–0.87 (median 0.33) for ciprofloxacin nonsusceptibility. For example, rates of Typhimurium infections with overall resistance were high for many states in the West/Midwest (e.g., Montana, South Dakota, Wyoming, Iowa, Colorado). Rates of Enteritidis infections with ciprofloxacin nonsusceptibility were low for many states in the South (e.g., Mississippi, Arkansas, Louisiana, South Carolina, Alabama).
We observed that the shrinkage of resistance proportions was inversely related to the number of isolates tested, (i.e., more shrinkage with smaller numbers). Examples are shown in the online Technical Appendix.
Model Estimates of Resistance Incidence Overall
Resistance incidence rates were relatively stable, and 95% CrIs overlapped substantially for the 3 periods (Figure 3). For overall Salmonella infections (Table 2), we estimated the incidence of resistant culture-confirmed infections per 100,000 person-years for 2004–2012 as follows: 1.93 (95% CrI 1.60–2.35) for any clinically important resistance, 1.07 (95% CrI 0.86–1.32) for ampicillin-only resistance, 0.51 (95% CrI 0.35–0.70) for ceftriaxone/ampicillin resistance, and 0.35 (95% CrI 0.24–0.51) for ciprofloxacin nonsusceptibility. Newport, Typhimurium, and Heidelberg accounted for 75% of the incidence of ceftriaxone/ampicillin-resistant infections; Typhimurium accounted for 59% of the incidence of ampicillin-only–resistant infections; and Enteritidis accounted for 45% of the incidence of ciprofloxacin-nonsusceptible infections. Overall, the 4 serotypes accounted for 73% of the incidence of Salmonella infections with any clinically important resistance.
This report provides much-needed national incidence estimates for clinically important antimicrobial drug–resistant Salmonella infections in the United States. Overall, we estimate the incidence of such culture-confirmed infections to be ≈2/100,000 person-years. Clinically important resistance is strongly linked to specific serotypes. Enteritidis accounts for about half the incidence of ciprofloxacin-nonsusceptible infections; Newport, Typhimurium, and Heidelberg for three fourths of the incidence of infections with resistance to both ceftriaxone and ampicillin; and Typhimurium for more than half the incidence of infections with ampicillin-only resistance. Many of these isolates with clinically important resistance are also resistant to other agents (8,9). Although these 4 serotypes account for about half of culture-confirmed Salmonella infections, they account for nearly three fourths of the incidence of clinically important resistant infections (6,9). This finding suggests that strategies to reduce the incidence of infections caused by these 4 serotypes could have a larger effect on reducing the incidence of resistant Salmonella infections overall.
Using the Bayesian hierarchical model, we improved the estimation of resistance incidence by addressing issues related to missing and sparse state data, particularly for certain combinations of serotypes and resistance. Both surveillance databases showed great variation in reporting by state and year; these variations are probably associated with testing only small numbers of isolates in certain states, underreporting, and incomplete serotyping (6,8). Therefore, crude estimates based on observed data could lead to biased estimation. We mitigated these issues by statistically borrowing strength from neighboring states and previous years (22). We present observed and predicted state resistance incidence estimates by year (online Technical Appendix) to illustrate how our Bayesian hierarchical model smooths state-to-state variability of observed data. We used an estimation scheme called shrinkage, which moved disparate estimates toward a common central value, leading to a more robust set of estimates (25). We noted that the shrinkage of resistance proportions was inversely related to the number of isolates tested (online Technical Appendix Figure 1).
Our analysis has limitations. Because LEDS is a passive surveillance system, underreporting probably occurs in most states (6); it was marked in Florida, and we adjusted for this only in the Bayesian hierarchical model (online Technical Appendix). We assumed that populations under surveillance are defined by the US Census population data, although populations are mobile and illnesses are sometimes reported by the state in which they are diagnosed rather than the state in which the patient resides (6,21). The proportion of isolates that were not fully serotyped varied by state and was much higher in LEDS than NARMS. This finding suggests that isolates submitted to NARMS were more likely to be serotyped; regardless, we found similar distributions of major serotypes in LEDS and NARMS. Our approach of imputing missing serotypes of nonserotyped and partially serotyped LEDS isolates by state is reasonable because of the similar distribution of major serotypes in NARMS and LEDS. We did not include serogroup information when imputing partially serotyped isolates; such an approach would not alter our estimates. However, refined methods for imputing partially serotyped isolates could be useful for other analyses.
Because we created mutually exclusive categories, our incidence estimates for ciprofloxacin nonsusceptibility and for ampicillin-only resistance do not include all Salmonella with ciprofloxacin nonsusceptibility and ampicillin resistance, respectively. Isolates resistant to ceftriaxone and ampicillin, of which there were many, and those resistant to ceftriaxone and nonsusceptible to ciprofloxacin, were included only in the ceftriaxone/ampicillin resistance category. Furthermore, we do not provide estimates for resistance to trimethoprim-sulfamethoxazole, which can be used for noninvasive infections (12); during 2004–2012, <2% of Salmonella isolates were resistant to trimethoprim-sulfamethoxazole, 79% of which were also resistant to ceftriaxone or ampicillin, or nonsusceptible to ciprofloxacin (8; CDC, unpub. data).
Surveillance data capture culture-confirmed infections only, which represent a fraction of all infections (6,8,9). Our estimates total ≈6,200 culture-confirmed Salmonella infections with clinically important resistance annually (21). CDC has estimated that for every laboratory-confirmed case of Salmonella, there are many other undetected cases; the most recent estimate is 29 infections for every 1 culture-confirmed case (1). Because persons with resistant infections are at increased risk for more serious illness that may result in medical attention, such infections may be more likely than susceptible infections to be detected through culture-based surveillance (15–18,26). The ratio of undetected to detected resistant infections has not been estimated.
We found marked state-to-state variation in the incidence of resistant infections. Additional modeling, taking into account the varying distributions of infections by geography, serotype, demographic subgroup, and season, would be needed to help elucidate the reasons (27,28). Infections among older persons have been associated with increased rates of invasive illness and hospitalization, which may be more likely to be detected; thus, these estimates may represent a higher proportion of older patients than actually exists (13,16,21,26). Estimates are based on resistance among all Salmonella isolates, which are mostly isolated from fecal samples (9). Therefore, these estimates of resistant infections represent mostly noninvasive infections, only a fraction of which may require antimicrobial treatment (9,12). About 27% of patients with culture-confirmed salmonellosis are hospitalized (1). If patients with resistant infections are more likely to be hospitalized, these estimates may disproportionately reflect hospitalized patients (15–18).
For our estimates, we used data based on current laboratory methods, reporting, and isolate submission practices in states. With increasing use of culture-independent diagnostic tests by clinical laboratories, we anticipate changes in reporting and submission of isolates to public health laboratories (29). These changes would warrant model adjustments for future estimation and assessment of changes over time.
Annual NARMS reporting of resistance percentages remains a useful approach for tracking resistance, particularly emerging resistance in serotypes in low numbers of tested isolates (8). The method we have developed (using 2 data sources) provides a way to understand changes in the incidence of resistance especially for serotypes like Heidelberg, which is decreasing in incidence but increasing in the proportion resistant to ceftriaxone (6,8,9). By estimating resistance incidence rather than percentage of resistant isolates, we remove a major confounder to interpretation of estimated resistance levels. Our 95% CrIs incorporate uncertainties associated with missing and sparse data. However, our results go a long way toward this understanding. The overlapping 95% CrIs for ceftriaxone-resistant Heidelberg that we found for the 3 periods suggest that incidence rates were relatively stable during 2004–2012. A future, more detailed analysis could assess resistance incidence trends in Heidelberg and other serotypes.
Antimicrobial drug use in food-producing animals is a major driver of—although not the only contributor to—resistant Salmonella infections. An example is the contribution of third-generation cephalosporin use in poultry to ceftriaxone resistance among Heidelberg infections of humans (30–32). FDA has taken actions to contain the spread of antimicrobial-resistant bacteria and prolong the usefulness of antimicrobial agents, including a strategy for limiting antimicrobial use in food animals to therapeutic uses and agents administered under veterinary supervision (9,33). Even more stringent actions are being applied in the European Union (9,34). Reservoirs of infection vary by serotype, and resistant infections have been linked to a variety of sources and exposures (7,17,35–37). For example, an outbreak of multidrug-resistant (MDR) Typhimurium infections with resistance to ampicillin was linked to consumption of contaminated ground beef (17,35). MDR Newport infections with resistance to ceftriaxone were linked to exposure to infected dairy cattle and consumption of contaminated ground beef (14,36). Infections with Enteritidis that are nonsusceptible to ciprofloxacin have been associated with international travel (37). Recently, MDR strains of other serotypes, including I 4,[5],12:i:- and Dublin, have become an increasing concern; these serotypes have been linked to swine and cattle sources, respectively (8,38). NARMS needs to continue to monitor emerging resistance patterns by serotype. The 4 major serotypes that have been driving the incidence of resistant infections should continue to be high priorities in combating resistance.
National incidence estimates of resistant Salmonella infections are needed to track progress to support the US President’s Executive Order to combat antibiotic-resistant bacteria (39,40). Such estimates help define the magnitude of the resistance problem, target prevention efforts, and assess whether control measures are working. Further development of these methods can be used to assess progress from control measures.
Dr. Medalla is an epidemiologist with the Division of Foodborne, Waterborne, and Environmental Diseases, National Center for Emerging and Zoonotic Infectious Diseases, CDC. Her main research interests include antimicrobial drug resistance in Salmonella and other foodborne/enteric pathogens.
Acknowledgments
We thank state and local health departments and their public health laboratories for their contributions to NARMS and LEDS.
This work was supported by CDC and the US FDA Center for Veterinary Medicine.
References
- Scallan E, Hoekstra RM, Angulo FJ, Tauxe RV, Widdowson MA, Roy SL, et al. Foodborne illness acquired in the United States—major pathogens. Emerg Infect Dis. 2011;17:7–15. DOIPubMedGoogle Scholar
- Centers for Disease Control and Prevention. Antibiotic resistance threats in the United States. 2013 [cited 2016 May 10]. http://www.cdc.gov/drugresistance/pdf/ar-threats-2013-508.pdf
- Gould LH, Walsh KA, Vieira AR, Herman K, Williams IT, Hall AJ, et al.; Centers for Disease Control and Prevention. Surveillance for foodborne disease outbreaks - United States, 1998-2008. MMWR Surveill Summ. 2013;62:1–34.PubMedGoogle Scholar
- Centers for Disease Control and Prevention (CDC). Surveillance for foodborne disease outbreaks—United States, 2009-2010. MMWR Morb Mortal Wkly Rep. 2013;62:41–7.PubMedGoogle Scholar
- Varma JK, Greene KD, Ovitt J, Barrett TJ, Medalla F, Angulo FJ. Hospitalization and antimicrobial resistance in Salmonella outbreaks, 1984-2002. Emerg Infect Dis. 2005;11:943–6. DOIPubMedGoogle Scholar
- Centers for Disease Control and Prevention. National Enteric Disease Surveillance: Salmonella annual report, 2012 [cited 2016 May 10]. http://wwwdev.cdc.gov/ncezid/dfwed/pdfs/salmonella-annual-report-2012-508c.pdf
- Crim SM, Griffin PM, Tauxe R, Marder EP, Gilliss D, Cronquist AB, et al.; Centers for Disease Control and Prevention (CDC). Preliminary incidence and trends of infection with pathogens transmitted commonly through food - Foodborne Diseases Active Surveillance Network, 10 U.S. sites, 2006-2014. MMWR Morb Mortal Wkly Rep. 2015;64:495–9.PubMedGoogle Scholar
- Centers for Disease Control and Prevention. National Antimicrobial Resistance Monitoring System for Enteric Bacteria (NARMS): human isolates final report, 2013. Atlanta: The Centers; 2015.
- Medalla F, Hoekstra RM, Whichard JM, Barzilay EJ, Chiller TM, Joyce K, et al. Increase in resistance to ceftriaxone and nonsusceptibility to ciprofloxacin and decrease in multidrug resistance among Salmonella strains, United States, 1996-2009. Foodborne Pathog Dis. 2013;10:302–9. DOIPubMedGoogle Scholar
- McDermott PF. Antimicrobial resistance in nontyphoidal salmonellae. In: Aarestrup FM, editor. Antimicrobial resistance in bacteria of animal origin. Washington (DC): ASM Press; 2006. p. 293–314.
- Jones TF, Ingram LA, Cieslak PR, Vugia DJ, Tobin-D’Angelo M, Hurd S, et al. Salmonellosis outcomes differ substantially by serotype. J Infect Dis. 2008;198:109–14. DOIPubMedGoogle Scholar
- Pegues DA, Miller SI. Salmonella species. In: Bennett JE, Dolin R, Blaser MJ, editors. Mandell, Douglas, and Bennett’s Principles and Practice of Infectious Diseases. Philadelphia (PA): Elsevier/Saunders, 2015. p. 2559–68.
- Crump JA, Barrett TJ, Nelson JT, Angulo FJ. Reevaluating fluoroquinolone breakpoints for Salmonella enterica serotype Typhi and for non-Typhi salmonellae. Clin Infect Dis. 2003;37:75–81. DOIPubMedGoogle Scholar
- Gupta A, Fontana J, Crowe C, Bolstorff B, Stout A, Van Duyne S, et al.; National Antimicrobial Resistance Monitoring System PulseNet Working Group. Emergence of multidrug-resistant Salmonella enterica serotype Newport infections resistant to expanded-spectrum cephalosporins in the United States. J Infect Dis. 2003;188:1707–16. DOIPubMedGoogle Scholar
- Fisk TL, Lundberg BE, Guest JL, Ray S, Barrett TJ, Holland B, et al. Invasive infection with multidrug-resistant Salmonella enterica serotype typhimurium definitive type 104 among HIV-infected adults. Clin Infect Dis. 2005;40:1016–21. DOIPubMedGoogle Scholar
- Helms M, Simonsen J, Mølbak K. Quinolone resistance is associated with increased risk of invasive illness or death during infection with Salmonella serotype Typhimurium. J Infect Dis. 2004;190:1652–4. DOIPubMedGoogle Scholar
- Krueger AL, Greene SA, Barzilay EJ, Henao O, Vugia D, Hanna S, et al. Clinical outcomes of nalidixic acid, ceftriaxone, and multidrug-resistant nontyphoidal salmonella infections compared with pansusceptible infections in FoodNet sites, 2006-2008. Foodborne Pathog Dis. 2014;11:335–41. DOIPubMedGoogle Scholar
- Varma JK, Molbak K, Barrett TJ, Beebe JL, Jones TF, Rabatsky-Ehr T, et al. Antimicrobial-resistant nontyphoidal Salmonella is associated with excess bloodstream infections and hospitalizations. J Infect Dis. 2005;191:554–61. DOIPubMedGoogle Scholar
- Clinical and Laboratory Standards Institute. Performance standards for antimicrobial susceptibility testing; twenty-fifth informational supplement (M100–S25). Wayne (PA): The Institute; 2015.
- Lunn DJ, Thomas A, Best N, Spiegelhalter D. WinBUGS—a Bayesian modelling framework: concepts, structure, and extensibility. Stat Comput. 2000;10:325–37. DOIGoogle Scholar
- US Census Bureau. Population estimates [cited 2016 May 10]. http://www.census.gov/popest/
- Ghosh M, Rao JNK. Small area estimation: an appraisal. Stat Sci. 1994;9:5576.
- Sturtz S, Ligges U, Gelman A. R2WinBUGS: a package for running WinBUGS from R. J Stat Softw. 2005;12:1–16. DOIGoogle Scholar
- Lambert PC, Sutton AJ, Burton PR, Abrams KR, Jones DR. How vague is vague? A simulation study of the impact of the use of vague prior distributions in MCMC using WinBUGS. Stat Med. 2005;24:2401–28. DOIPubMedGoogle Scholar
- Crump JA, Medalla FM, Joyce KW, Krueger AL, Hoekstra RM, Whichard JM, et al.; Emerging Infections Program NARMS Working Group. Antimicrobial resistance among invasive nontyphoidal Salmonella enterica isolates in the United States: National Antimicrobial Resistance Monitoring System, 1996 to 2007. Antimicrob Agents Chemother. 2011;55:1148–54. DOIPubMedGoogle Scholar
- Boore AL, Hoekstra RM, Iwamoto M, Fields PI, Bishop RD, Swerdlow DL. Salmonella enterica infections in the United States and assessment of coefficients of variation: a novel approach to identify epidemiologic characteristics of individual serotypes, 1996–2011. PLoS One. 2015;10:e0145416. DOIPubMedGoogle Scholar
- Greene SK, Stuart AM, Medalla FM, Whichard JM, Hoekstra RM, Chiller TM. Distribution of multidrug-resistant human isolates of MDR-ACSSuT Salmonella Typhimurium and MDR-AmpC Salmonella Newport in the United States, 2003-2005. Foodborne Pathog Dis. 2008;5:669–80. DOIPubMedGoogle Scholar
- Iwamoto M, Huang JY, Cronquist AB, Medus C, Hurd S, Zansky S, et al.; Centers for Disease Control and Prevention (CDC). Bacterial enteric infections detected by culture-independent diagnostic tests—FoodNet, United States, 2012-2014. MMWR Morb Mortal Wkly Rep. 2015;64:252–7.PubMedGoogle Scholar
- Angulo FJ, Nargund VN, Chiller TC. Evidence of an association between use of anti-microbial agents in food animals and anti-microbial resistance among bacteria isolated from humans and the human health consequences of such resistance. J Vet Med B Infect Dis Vet Public Health. 2004;51:374–9. DOIPubMedGoogle Scholar
- Dutil L, Irwin R, Finley R, Ng LK, Avery B, Boerlin P, et al. Ceftiofur resistance in Salmonella enterica serovar Heidelberg from chicken meat and humans, Canada. Emerg Infect Dis. 2010;16:48–54. DOIPubMedGoogle Scholar
- Folster JP, Pecic G, Singh A, Duval B, Rickert R, Ayers S, et al. Characterization of extended-spectrum cephalosporin-resistant Salmonella enterica serovar Heidelberg isolated from food animals, retail meat, and humans in the United States 2009. Foodborne Pathog Dis. 2012;9:638–45. DOIPubMedGoogle Scholar
- US Food and Drug Administration. Guidance for industry: the judicious use of medically important antimicrobial drugs in food-producing animals. #209. 2012 [cited 2016 May 10]. http://www.fda.gov/downloads/AnimalVeterinary/GuidanceComplianceEnforcement/GuidanceforIndustry/UCM216936.pdf
- Cogliani C, Goossens H, Greko C. Restricting antimicrobial use in food animals: lessons from Europe. Microbe. 2011;6:274–9.
- Dechet AM, Scallan E, Gensheimer K, Hoekstra R, Gunderman-King J, Lockett J, et al.; Multistate Working Group. Outbreak of multidrug-resistant Salmonella enterica serotype Typhimurium Definitive Type 104 infection linked to commercial ground beef, northeastern United States, 2003-2004. Clin Infect Dis. 2006;42:747–52. DOIPubMedGoogle Scholar
- Varma JK, Marcus R, Stenzel SA, Hanna SS, Gettner S, Anderson BJ, et al. Highly resistant Salmonella Newport-MDRAmpC transmitted through the domestic US food supply: a FoodNet case-control study of sporadic Salmonella Newport infections, 2002-2003. J Infect Dis. 2006;194:222–30. DOIPubMedGoogle Scholar
- O’Donnell AT, Vieira AR, Huang JY, Whichard J, Cole D, Karp BE. Quinolone-resistant Salmonella enterica serotype Enteritidis infections associated with international travel. Clin Infect Dis. 2014;59:e139–41. DOIPubMedGoogle Scholar
- McDonough PL, Fogelman D, Shin SJ, Brunner MA, Lein DH. Salmonella enterica serotype Dublin infection: an emerging infectious disease for the northeastern United States. J Clin Microbiol. 1999;37:2418–27.PubMedGoogle Scholar
- The White House, Office of the Press Secretary. Executive order—combating antibiotic-resistant bacteria. 2014 [cited 2016 Aug 31]. https://www.whitehouse.gov/the-press-office/2014/09/18/executive-order-combating-antibiotic-resistant-bacteria
- The White House. National strategy for combating antibiotic-resistant bacteria. 2014 [cited 2016 Aug 31]. https://www.whitehouse.gov/sites/default/files/docs/carb_national_strategy.pdf
Figures
Tables
Cite This ArticleTable of Contents – Volume 23, Number 1—January 2017
| EID Search Options |
|---|
|
|
|
|
|
|
Please use the form below to submit correspondence to the authors or contact them at the following address:
Felicita Medalla, Centers for Disease Control and Prevention, 1600 Clifton Rd, NE, Mailstop C09, Atlanta, GA 30329-4027, USA
Top