Skip directly to site content Skip directly to page options Skip directly to A-Z link Skip directly to A-Z link Skip directly to A-Z link
Volume 24, Number 8—August 2018
Research

Human Norovirus Replication in Human Intestinal Enteroids as Model to Evaluate Virus Inactivation

Veronica CostantiniComments to Author , Esther K. Morantz, Hannah Browne, Khalil Ettayebi, Xi-Lei Zeng, Robert L. Atmar, Mary K. Estes, and Jan Vinjé
Author affiliations: Centers for Disease Control and Prevention, Atlanta, Georgia, USA (V. Costantini, J. Vinjé); Synergy America, Inc., Atlanta (E.K. Morantz); Oak Ridge Institute for Science and Education, Oak Ridge, Tennessee, USA (H. Browne); Baylor College of Medicine, Houston, Texas, USA (K. Ettayebi, X.-L. Zeng, R.L. Atmar, M.K. Estes)

Main Article

Figure 6

Comparison of amount of input viral RNA with success of human norovirus replication in human intestinal enteroids (HIEs). A) We infected HIE monolayers with undiluted or prediluted (1:10; 1:100; 1:1000) 10% fecal filtrates. Each dot represents the input norovirus RNA per well of a single experiment (n = 168) that resulted in successful (n = 78) or unsuccessful (n = 90) virus replication. Boxes represent 25th percentile, median, and 75th percentile, and whiskers show the minimum and maximum value

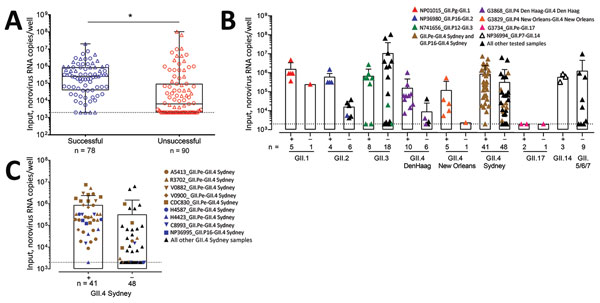
Figure 6. Comparison of amount of input viral RNA with success of human norovirus replication in human intestinal enteroids (HIEs). A) We infected HIE monolayers with undiluted or prediluted (1:10; 1:100; 1:1000) 10% fecal filtrates. Each dot represents the input norovirus RNA per well of a single experiment (n = 168) that resulted in successful (n = 78) or unsuccessful (n = 90) virus replication. Boxes represent 25th percentile, median, and 75th percentile, and whiskers show the minimum and maximum values. Circles indicate GII.4 genotypes and triangles non-GII.4 genotypes. ***p<0.001 by Mann-Whitney test. B, C) Role of initial norovirus RNA input in successful (+) and unsuccessful (–) human norovirus infections. We infected HIE monolayers with undiluted or prediluted (1:10; 1:100; 1:1000) 10% fecal filtrates and incubated them at 37°C in 5% CO2 for 3 d. We extracted RNA and quantified it by quantitative reverse transcription PCR from frozen lysates (cells and supernatant) at 1 hour postinfection and 3 days postinfection. Data points represent individual experiments. Bars represent mean + SD. Dotted lines represent RT-qPCR limit of detection. Samples that successfully replicate at high, but not low, concentration are colored and listed in Table 2.

Main Article

Page created: July 18, 2018
Page updated: July 18, 2018
Page reviewed: July 18, 2018
The conclusions, findings, and opinions expressed by authors contributing to this journal do not necessarily reflect the official position of the U.S. Department of Health and Human Services, the Public Health Service, the Centers for Disease Control and Prevention, or the authors' affiliated institutions. Use of trade names is for identification only and does not imply endorsement by any of the groups named above.
file_external